Nepalese vs Arapaho Householder Income Ages 25 - 44 years
COMPARE
Nepalese
Arapaho
Householder Income Ages 25 - 44 years
Householder Income Ages 25 - 44 years Comparison
Nepalese
Arapaho
$91,498
HOUSEHOLDER INCOME AGES 25 - 44 YEARS
15.4/ 100
METRIC RATING
204th/ 347
METRIC RANK
$71,697
HOUSEHOLDER INCOME AGES 25 - 44 YEARS
0.0/ 100
METRIC RATING
341st/ 347
METRIC RANK
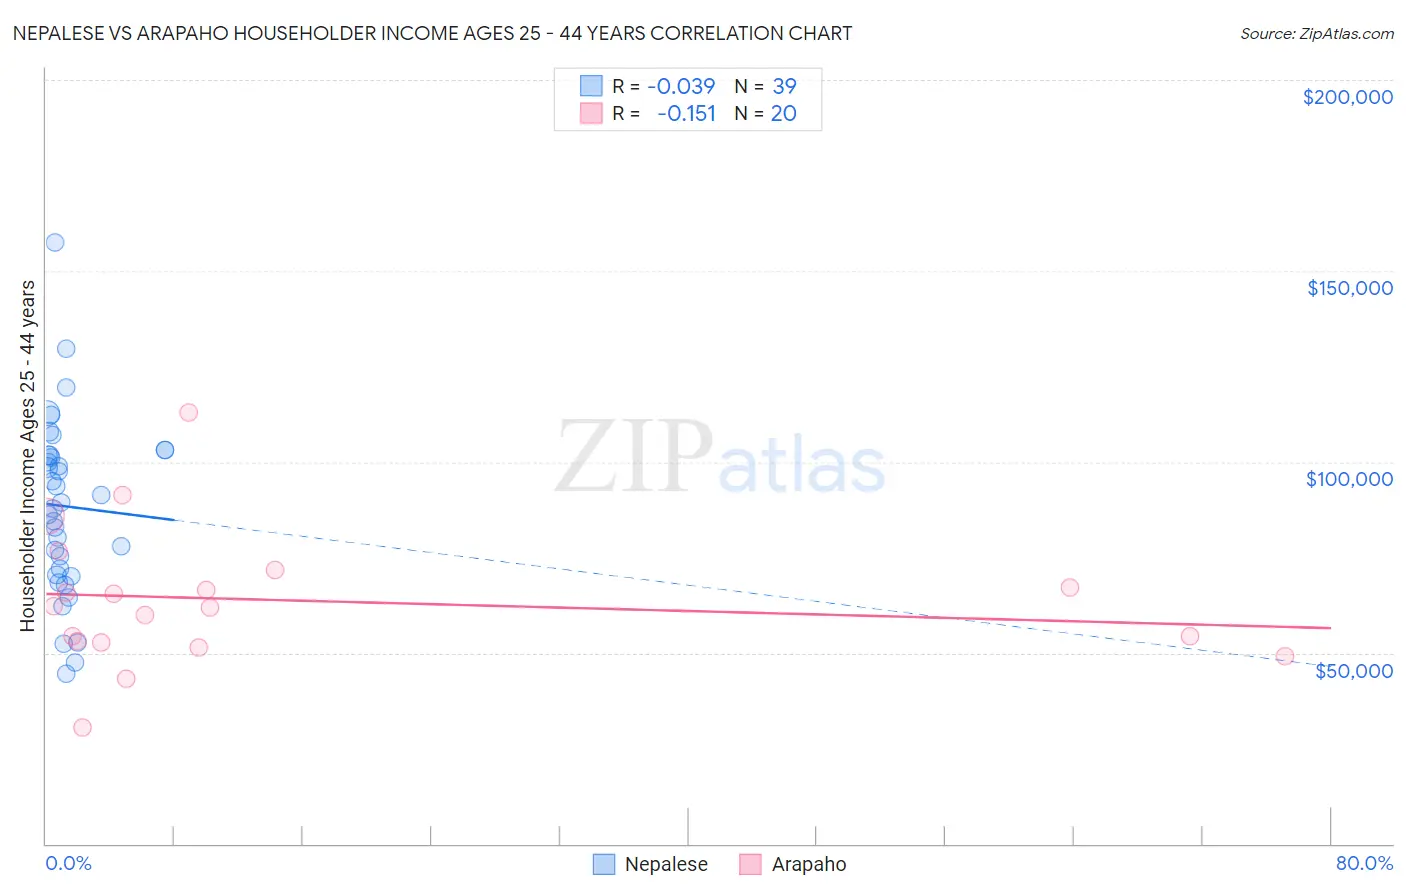
Nepalese vs Arapaho Householder Income Ages 25 - 44 years Correlation Chart
The statistical analysis conducted on geographies consisting of 24,520,458 people shows no correlation between the proportion of Nepalese and household income with householder between the ages 25 and 44 in the United States with a correlation coefficient (R) of -0.039 and weighted average of $91,498. Similarly, the statistical analysis conducted on geographies consisting of 29,750,009 people shows a poor negative correlation between the proportion of Arapaho and household income with householder between the ages 25 and 44 in the United States with a correlation coefficient (R) of -0.151 and weighted average of $71,697, a difference of 27.6%.
Householder Income Ages 25 - 44 years Correlation Summary
| Measurement | Nepalese | Arapaho |
| Minimum | $44,671 | $30,478 |
| Maximum | $157,344 | $113,036 |
| Range | $112,673 | $82,558 |
| Mean | $88,333 | $63,768 |
| Median | $89,253 | $62,022 |
| Interquartile 25% (IQ1) | $70,481 | $52,738 |
| Interquartile 75% (IQ3) | $101,731 | $69,428 |
| Interquartile Range (IQR) | $31,250 | $16,690 |
| Standard Deviation (Sample) | $23,217 | $18,151 |
| Standard Deviation (Population) | $22,917 | $17,692 |
Similar Demographics by Householder Income Ages 25 - 44 years
Demographics Similar to Nepalese by Householder Income Ages 25 - 44 years
In terms of householder income ages 25 - 44 years, the demographic groups most similar to Nepalese are Immigrants from Cambodia ($91,533, a difference of 0.040%), Immigrants from Eastern Africa ($91,458, a difference of 0.040%), Ecuadorian ($91,574, a difference of 0.080%), Japanese ($91,624, a difference of 0.14%), and Aleut ($91,370, a difference of 0.14%).
| Demographics | Rating | Rank | Householder Income Ages 25 - 44 years |
| Spanish | 21.2 /100 | #197 | Fair $92,200 |
| Vietnamese | 20.2 /100 | #198 | Fair $92,089 |
| Kenyans | 16.8 /100 | #199 | Poor $91,684 |
| Whites/Caucasians | 16.7 /100 | #200 | Poor $91,668 |
| Japanese | 16.4 /100 | #201 | Poor $91,624 |
| Ecuadorians | 16.0 /100 | #202 | Poor $91,574 |
| Immigrants | Cambodia | 15.7 /100 | #203 | Poor $91,533 |
| Nepalese | 15.4 /100 | #204 | Poor $91,498 |
| Immigrants | Eastern Africa | 15.2 /100 | #205 | Poor $91,458 |
| Aleuts | 14.5 /100 | #206 | Poor $91,370 |
| Yugoslavians | 14.5 /100 | #207 | Poor $91,368 |
| Immigrants | Thailand | 14.3 /100 | #208 | Poor $91,337 |
| Immigrants | Uruguay | 13.2 /100 | #209 | Poor $91,171 |
| Immigrants | Kenya | 10.9 /100 | #210 | Poor $90,767 |
| Iraqis | 10.8 /100 | #211 | Poor $90,764 |
Demographics Similar to Arapaho by Householder Income Ages 25 - 44 years
In terms of householder income ages 25 - 44 years, the demographic groups most similar to Arapaho are Crow ($71,337, a difference of 0.50%), Immigrants from Congo ($72,178, a difference of 0.67%), Yuman ($72,956, a difference of 1.8%), Immigrants from Yemen ($73,043, a difference of 1.9%), and Black/African American ($73,370, a difference of 2.3%).
| Demographics | Rating | Rank | Householder Income Ages 25 - 44 years |
| Hopi | 0.0 /100 | #333 | Tragic $75,002 |
| Creek | 0.0 /100 | #334 | Tragic $74,847 |
| Kiowa | 0.0 /100 | #335 | Tragic $74,776 |
| Yup'ik | 0.0 /100 | #336 | Tragic $73,688 |
| Blacks/African Americans | 0.0 /100 | #337 | Tragic $73,370 |
| Immigrants | Yemen | 0.0 /100 | #338 | Tragic $73,043 |
| Yuman | 0.0 /100 | #339 | Tragic $72,956 |
| Immigrants | Congo | 0.0 /100 | #340 | Tragic $72,178 |
| Arapaho | 0.0 /100 | #341 | Tragic $71,697 |
| Crow | 0.0 /100 | #342 | Tragic $71,337 |
| Tohono O'odham | 0.0 /100 | #343 | Tragic $69,068 |
| Pueblo | 0.0 /100 | #344 | Tragic $68,910 |
| Navajo | 0.0 /100 | #345 | Tragic $66,529 |
| Puerto Ricans | 0.0 /100 | #346 | Tragic $65,996 |
| Lumbee | 0.0 /100 | #347 | Tragic $60,305 |