Zimbabwean vs Immigrants from Poland Householder Income Ages 25 - 44 years
COMPARE
Zimbabwean
Immigrants from Poland
Householder Income Ages 25 - 44 years
Householder Income Ages 25 - 44 years Comparison
Zimbabweans
Immigrants from Poland
$98,586
HOUSEHOLDER INCOME AGES 25 - 44 YEARS
90.3/ 100
METRIC RATING
124th/ 347
METRIC RANK
$101,065
HOUSEHOLDER INCOME AGES 25 - 44 YEARS
97.4/ 100
METRIC RATING
104th/ 347
METRIC RANK
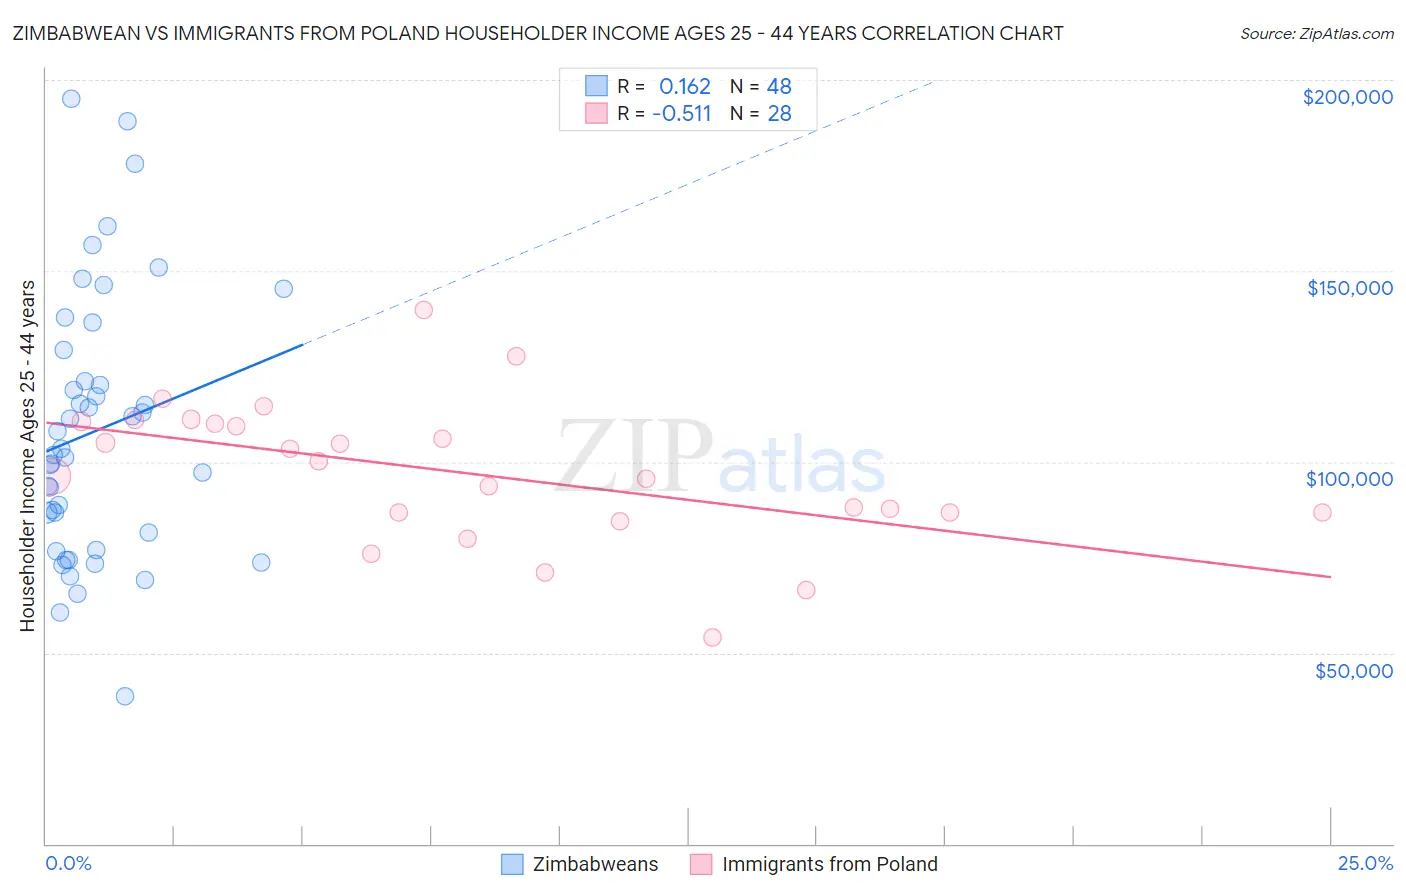
Zimbabwean vs Immigrants from Poland Householder Income Ages 25 - 44 years Correlation Chart
The statistical analysis conducted on geographies consisting of 69,182,537 people shows a poor positive correlation between the proportion of Zimbabweans and household income with householder between the ages 25 and 44 in the United States with a correlation coefficient (R) of 0.162 and weighted average of $98,586. Similarly, the statistical analysis conducted on geographies consisting of 304,269,363 people shows a substantial negative correlation between the proportion of Immigrants from Poland and household income with householder between the ages 25 and 44 in the United States with a correlation coefficient (R) of -0.511 and weighted average of $101,065, a difference of 2.5%.
Householder Income Ages 25 - 44 years Correlation Summary
| Measurement | Zimbabwean | Immigrants from Poland |
| Minimum | $38,611 | $53,849 |
| Maximum | $194,972 | $139,903 |
| Range | $156,361 | $86,054 |
| Mean | $108,063 | $97,277 |
| Median | $102,697 | $98,174 |
| Interquartile 25% (IQ1) | $79,354 | $86,748 |
| Interquartile 75% (IQ3) | $125,334 | $110,162 |
| Interquartile Range (IQR) | $45,980 | $23,414 |
| Standard Deviation (Sample) | $34,623 | $18,764 |
| Standard Deviation (Population) | $34,261 | $18,426 |
Demographics Similar to Zimbabweans and Immigrants from Poland by Householder Income Ages 25 - 44 years
In terms of householder income ages 25 - 44 years, the demographic groups most similar to Zimbabweans are Palestinian ($98,777, a difference of 0.19%), Immigrants from Uzbekistan ($98,849, a difference of 0.27%), Peruvian ($98,886, a difference of 0.30%), Swedish ($99,136, a difference of 0.56%), and Jordanian ($99,186, a difference of 0.61%). Similarly, the demographic groups most similar to Immigrants from Poland are Immigrants from Vietnam ($100,535, a difference of 0.53%), Immigrants from Brazil ($100,534, a difference of 0.53%), Northern European ($100,457, a difference of 0.61%), Immigrants from South Eastern Asia ($100,283, a difference of 0.78%), and Immigrants from North Macedonia ($100,101, a difference of 0.96%).
| Demographics | Rating | Rank | Householder Income Ages 25 - 44 years |
| Immigrants | Poland | 97.4 /100 | #104 | Exceptional $101,065 |
| Immigrants | Vietnam | 96.5 /100 | #105 | Exceptional $100,535 |
| Immigrants | Brazil | 96.5 /100 | #106 | Exceptional $100,534 |
| Northern Europeans | 96.3 /100 | #107 | Exceptional $100,457 |
| Immigrants | South Eastern Asia | 96.0 /100 | #108 | Exceptional $100,283 |
| Immigrants | North Macedonia | 95.6 /100 | #109 | Exceptional $100,101 |
| Immigrants | Afghanistan | 95.3 /100 | #110 | Exceptional $99,977 |
| Chileans | 95.1 /100 | #111 | Exceptional $99,900 |
| Poles | 94.5 /100 | #112 | Exceptional $99,685 |
| Tongans | 94.2 /100 | #113 | Exceptional $99,604 |
| Immigrants | Western Asia | 94.0 /100 | #114 | Exceptional $99,516 |
| Carpatho Rusyns | 93.7 /100 | #115 | Exceptional $99,449 |
| Portuguese | 93.7 /100 | #116 | Exceptional $99,429 |
| Immigrants | Northern Africa | 93.0 /100 | #117 | Exceptional $99,232 |
| Syrians | 92.9 /100 | #118 | Exceptional $99,215 |
| Jordanians | 92.8 /100 | #119 | Exceptional $99,186 |
| Swedes | 92.7 /100 | #120 | Exceptional $99,136 |
| Peruvians | 91.7 /100 | #121 | Exceptional $98,886 |
| Immigrants | Uzbekistan | 91.5 /100 | #122 | Exceptional $98,849 |
| Palestinians | 91.2 /100 | #123 | Exceptional $98,777 |
| Zimbabweans | 90.3 /100 | #124 | Exceptional $98,586 |