South African vs Immigrants from Sweden Householder Income Ages 45 - 64 years
COMPARE
South African
Immigrants from Sweden
Householder Income Ages 45 - 64 years
Householder Income Ages 45 - 64 years Comparison
South Africans
Immigrants from Sweden
$109,719
HOUSEHOLDER INCOME AGES 45 - 64 YEARS
99.1/ 100
METRIC RATING
75th/ 347
METRIC RANK
$118,318
HOUSEHOLDER INCOME AGES 45 - 64 YEARS
100.0/ 100
METRIC RATING
26th/ 347
METRIC RANK
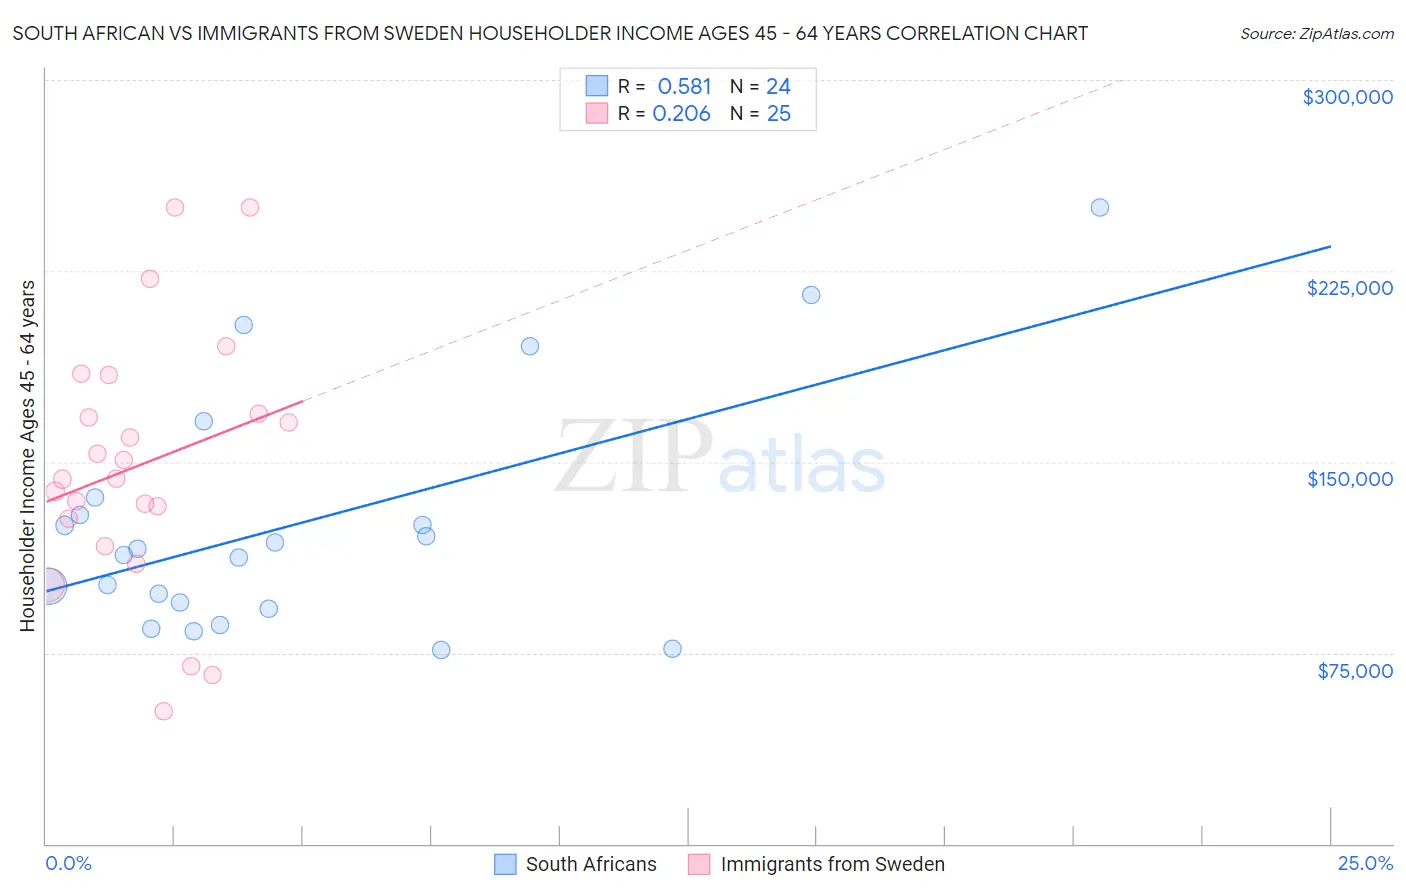
South African vs Immigrants from Sweden Householder Income Ages 45 - 64 years Correlation Chart
The statistical analysis conducted on geographies consisting of 182,453,262 people shows a substantial positive correlation between the proportion of South Africans and household income with householder between the ages 45 and 64 in the United States with a correlation coefficient (R) of 0.581 and weighted average of $109,719. Similarly, the statistical analysis conducted on geographies consisting of 164,674,181 people shows a weak positive correlation between the proportion of Immigrants from Sweden and household income with householder between the ages 45 and 64 in the United States with a correlation coefficient (R) of 0.206 and weighted average of $118,318, a difference of 7.8%.
Householder Income Ages 45 - 64 years Correlation Summary
| Measurement | South African | Immigrants from Sweden |
| Minimum | $76,250 | $52,031 |
| Maximum | $250,001 | $250,001 |
| Range | $173,751 | $197,970 |
| Mean | $125,894 | $148,842 |
| Median | $114,605 | $143,294 |
| Interquartile 25% (IQ1) | $93,424 | $122,314 |
| Interquartile 75% (IQ3) | $132,734 | $176,365 |
| Interquartile Range (IQR) | $39,311 | $54,051 |
| Standard Deviation (Sample) | $46,946 | $50,116 |
| Standard Deviation (Population) | $45,958 | $49,103 |
Similar Demographics by Householder Income Ages 45 - 64 years
Demographics Similar to South Africans by Householder Income Ages 45 - 64 years
In terms of householder income ages 45 - 64 years, the demographic groups most similar to South Africans are Immigrants from Egypt ($109,941, a difference of 0.20%), Paraguayan ($109,447, a difference of 0.25%), Immigrants from England ($109,446, a difference of 0.25%), Immigrants from Canada ($109,402, a difference of 0.29%), and Immigrants from Bulgaria ($109,379, a difference of 0.31%).
| Demographics | Rating | Rank | Householder Income Ages 45 - 64 years |
| Immigrants | Romania | 99.4 /100 | #68 | Exceptional $110,633 |
| Immigrants | Italy | 99.4 /100 | #69 | Exceptional $110,434 |
| Koreans | 99.3 /100 | #70 | Exceptional $110,334 |
| Italians | 99.3 /100 | #71 | Exceptional $110,224 |
| Assyrians/Chaldeans/Syriacs | 99.3 /100 | #72 | Exceptional $110,201 |
| Argentineans | 99.3 /100 | #73 | Exceptional $110,103 |
| Immigrants | Egypt | 99.2 /100 | #74 | Exceptional $109,941 |
| South Africans | 99.1 /100 | #75 | Exceptional $109,719 |
| Paraguayans | 99.0 /100 | #76 | Exceptional $109,447 |
| Immigrants | England | 99.0 /100 | #77 | Exceptional $109,446 |
| Immigrants | Canada | 99.0 /100 | #78 | Exceptional $109,402 |
| Immigrants | Bulgaria | 98.9 /100 | #79 | Exceptional $109,379 |
| Jordanians | 98.9 /100 | #80 | Exceptional $109,376 |
| Immigrants | Eastern Europe | 98.9 /100 | #81 | Exceptional $109,335 |
| Immigrants | North America | 98.8 /100 | #82 | Exceptional $109,198 |
Demographics Similar to Immigrants from Sweden by Householder Income Ages 45 - 64 years
In terms of householder income ages 45 - 64 years, the demographic groups most similar to Immigrants from Sweden are Asian ($118,426, a difference of 0.090%), Immigrants from Japan ($118,498, a difference of 0.15%), Immigrants from Northern Europe ($117,930, a difference of 0.33%), Turkish ($117,814, a difference of 0.43%), and Bolivian ($118,871, a difference of 0.47%).
| Demographics | Rating | Rank | Householder Income Ages 45 - 64 years |
| Eastern Europeans | 100.0 /100 | #19 | Exceptional $120,684 |
| Immigrants | Australia | 100.0 /100 | #20 | Exceptional $119,308 |
| Immigrants | Sri Lanka | 100.0 /100 | #21 | Exceptional $119,094 |
| Immigrants | Belgium | 100.0 /100 | #22 | Exceptional $118,932 |
| Bolivians | 100.0 /100 | #23 | Exceptional $118,871 |
| Immigrants | Japan | 100.0 /100 | #24 | Exceptional $118,498 |
| Asians | 100.0 /100 | #25 | Exceptional $118,426 |
| Immigrants | Sweden | 100.0 /100 | #26 | Exceptional $118,318 |
| Immigrants | Northern Europe | 100.0 /100 | #27 | Exceptional $117,930 |
| Turks | 100.0 /100 | #28 | Exceptional $117,814 |
| Bhutanese | 100.0 /100 | #29 | Exceptional $117,750 |
| Immigrants | Bolivia | 100.0 /100 | #30 | Exceptional $117,731 |
| Immigrants | Asia | 100.0 /100 | #31 | Exceptional $116,566 |
| Russians | 100.0 /100 | #32 | Exceptional $116,328 |
| Chinese | 100.0 /100 | #33 | Exceptional $116,156 |