Immigrants from Serbia vs Immigrants from Sweden Householder Income Ages 45 - 64 years
COMPARE
Immigrants from Serbia
Immigrants from Sweden
Householder Income Ages 45 - 64 years
Householder Income Ages 45 - 64 years Comparison
Immigrants from Serbia
Immigrants from Sweden
$107,569
HOUSEHOLDER INCOME AGES 45 - 64 YEARS
97.4/ 100
METRIC RATING
100th/ 347
METRIC RANK
$118,318
HOUSEHOLDER INCOME AGES 45 - 64 YEARS
100.0/ 100
METRIC RATING
26th/ 347
METRIC RANK
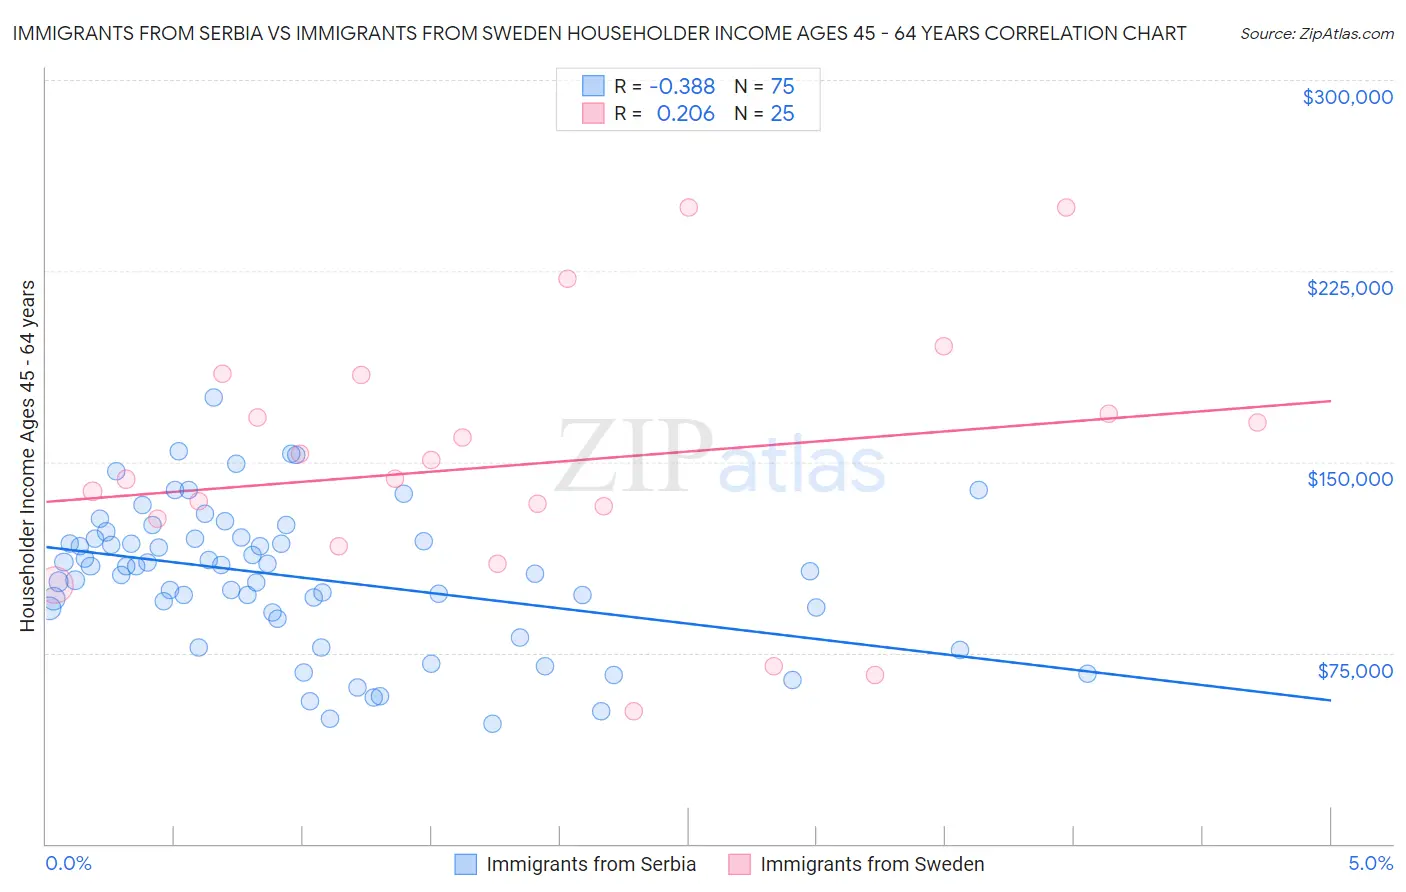
Immigrants from Serbia vs Immigrants from Sweden Householder Income Ages 45 - 64 years Correlation Chart
The statistical analysis conducted on geographies consisting of 131,681,242 people shows a mild negative correlation between the proportion of Immigrants from Serbia and household income with householder between the ages 45 and 64 in the United States with a correlation coefficient (R) of -0.388 and weighted average of $107,569. Similarly, the statistical analysis conducted on geographies consisting of 164,674,181 people shows a weak positive correlation between the proportion of Immigrants from Sweden and household income with householder between the ages 45 and 64 in the United States with a correlation coefficient (R) of 0.206 and weighted average of $118,318, a difference of 10.0%.
Householder Income Ages 45 - 64 years Correlation Summary
| Measurement | Immigrants from Serbia | Immigrants from Sweden |
| Minimum | $47,000 | $52,031 |
| Maximum | $175,247 | $250,001 |
| Range | $128,247 | $197,970 |
| Mean | $104,599 | $148,842 |
| Median | $108,917 | $143,294 |
| Interquartile 25% (IQ1) | $90,676 | $122,314 |
| Interquartile 75% (IQ3) | $119,792 | $176,365 |
| Interquartile Range (IQR) | $29,116 | $54,051 |
| Standard Deviation (Sample) | $27,672 | $50,116 |
| Standard Deviation (Population) | $27,487 | $49,103 |
Similar Demographics by Householder Income Ages 45 - 64 years
Demographics Similar to Immigrants from Serbia by Householder Income Ages 45 - 64 years
In terms of householder income ages 45 - 64 years, the demographic groups most similar to Immigrants from Serbia are Palestinian ($107,721, a difference of 0.14%), Immigrants from Kazakhstan ($107,378, a difference of 0.18%), Immigrants from Southern Europe ($107,775, a difference of 0.19%), Immigrants from Moldova ($107,357, a difference of 0.20%), and Northern European ($107,870, a difference of 0.28%).
| Demographics | Rating | Rank | Householder Income Ages 45 - 64 years |
| Immigrants | Croatia | 98.2 /100 | #93 | Exceptional $108,304 |
| Sri Lankans | 98.2 /100 | #94 | Exceptional $108,270 |
| Immigrants | Hungary | 98.2 /100 | #95 | Exceptional $108,267 |
| Immigrants | Argentina | 98.2 /100 | #96 | Exceptional $108,264 |
| Northern Europeans | 97.8 /100 | #97 | Exceptional $107,870 |
| Immigrants | Southern Europe | 97.7 /100 | #98 | Exceptional $107,775 |
| Palestinians | 97.6 /100 | #99 | Exceptional $107,721 |
| Immigrants | Serbia | 97.4 /100 | #100 | Exceptional $107,569 |
| Immigrants | Kazakhstan | 97.2 /100 | #101 | Exceptional $107,378 |
| Immigrants | Moldova | 97.1 /100 | #102 | Exceptional $107,357 |
| Syrians | 96.9 /100 | #103 | Exceptional $107,207 |
| Immigrants | Ukraine | 96.7 /100 | #104 | Exceptional $107,079 |
| Macedonians | 96.7 /100 | #105 | Exceptional $107,074 |
| Armenians | 96.6 /100 | #106 | Exceptional $107,002 |
| Immigrants | Fiji | 96.5 /100 | #107 | Exceptional $106,952 |
Demographics Similar to Immigrants from Sweden by Householder Income Ages 45 - 64 years
In terms of householder income ages 45 - 64 years, the demographic groups most similar to Immigrants from Sweden are Asian ($118,426, a difference of 0.090%), Immigrants from Japan ($118,498, a difference of 0.15%), Immigrants from Northern Europe ($117,930, a difference of 0.33%), Turkish ($117,814, a difference of 0.43%), and Bolivian ($118,871, a difference of 0.47%).
| Demographics | Rating | Rank | Householder Income Ages 45 - 64 years |
| Eastern Europeans | 100.0 /100 | #19 | Exceptional $120,684 |
| Immigrants | Australia | 100.0 /100 | #20 | Exceptional $119,308 |
| Immigrants | Sri Lanka | 100.0 /100 | #21 | Exceptional $119,094 |
| Immigrants | Belgium | 100.0 /100 | #22 | Exceptional $118,932 |
| Bolivians | 100.0 /100 | #23 | Exceptional $118,871 |
| Immigrants | Japan | 100.0 /100 | #24 | Exceptional $118,498 |
| Asians | 100.0 /100 | #25 | Exceptional $118,426 |
| Immigrants | Sweden | 100.0 /100 | #26 | Exceptional $118,318 |
| Immigrants | Northern Europe | 100.0 /100 | #27 | Exceptional $117,930 |
| Turks | 100.0 /100 | #28 | Exceptional $117,814 |
| Bhutanese | 100.0 /100 | #29 | Exceptional $117,750 |
| Immigrants | Bolivia | 100.0 /100 | #30 | Exceptional $117,731 |
| Immigrants | Asia | 100.0 /100 | #31 | Exceptional $116,566 |
| Russians | 100.0 /100 | #32 | Exceptional $116,328 |
| Chinese | 100.0 /100 | #33 | Exceptional $116,156 |