Yup'ik vs Austrian Per Capita Income

COMPARE

Yup'ik
Race
Ancestry
AfghanAfricanAlaska NativeAlaskan AthabascanAlbanianAleutAlsatianAmericanApacheArabArapahoArgentineanArmenianAssyrian/Chaldean/SyriacAustralianBahamianBangladeshiBarbadianBasqueBelgianBelizeanBermudanBhutaneseBlackfeetBolivianBrazilianBritishBritish West IndianBulgarianBurmeseCajunCambodianCanadianCape VerdeanCarpatho RusynCelticCentral AmericanCentral American IndianCherokeeCheyenneChickasawChileanChineseChippewaChoctawColombianColvilleComancheCosta RicanCreeCreekCroatianCrowCubanCypriotCzechCzechoslovakianDanishDelawareDominicanDutchDutch West IndianEastern EuropeanEcuadorianEgyptianEnglishEstonianEthiopianEuropeanFijianFilipinoFinnishFrenchFrench American IndianFrench CanadianGermanGerman RussianGhanaianGreekGuamanian/ChamorroGuatemalanGuyaneseHaitianHmongHonduranHopiHoumaHungarianIcelanderIndian (Asian)IndonesianInupiatIranianIraqiIrishIroquoisIsraeliItalianJamaicanJapaneseJordanianKenyanKiowaKoreanLaotianLatvianLebaneseLiberianLithuanianLumbeeLuxembourgerMacedonianMalaysianMalteseMarshalleseMenomineeMexicanMexican American IndianMongolianMoroccanNative HawaiianNavajoNepaleseNew ZealanderNicaraguanNigerianNorthern EuropeanNorwegianOkinawanOsageOttawaPaiutePakistaniPalestinianPanamanianParaguayanPennsylvania GermanPeruvianPimaPolishPortuguesePotawatomiPuebloPuerto RicanPuget Sound SalishRomanianRussianSalvadoranSamoanScandinavianScotch-IrishScottishSeminoleSenegaleseSerbianShoshoneSierra LeoneanSiouxSlavicSlovakSloveneSomaliSouth AfricanSouth AmericanSouth American IndianSoviet UnionSpaniardSpanishSpanish AmericanSpanish American IndianSri LankanSubsaharan AfricanSudaneseSwedishSwissSyrianTaiwaneseThaiTlingit-HaidaTohono O'OdhamTonganTrinidadian and TobagonianTsimshianTurkishU.S. Virgin IslanderUgandanUkrainianUruguayanUteVenezuelanVietnameseWelshWest IndianYakamaYaquiYugoslavianYumanYup'ikZimbabwean
Immigration
NonimmigrantsImmigrantsAfghanistanAfricaAlbaniaArgentinaArmeniaAsiaAustraliaAustriaBahamasBangladeshBarbadosBelarusBelgiumBelizeBoliviaBosnia and HerzegovinaBrazilBulgariaBurma/MyanmarCabo VerdeCambodiaCameroonCanadaCaribbeanCentral AmericaChileChinaColombiaCongoCosta RicaCroatiaCubaCzechoslovakiaDenmarkDominicaDominican RepublicEastern AfricaEastern AsiaEastern EuropeEcuadorEgyptEl SalvadorEnglandEritreaEthiopiaEuropeFijiFranceGermanyGhanaGreeceGrenadaGuatemalaGuyanaHaitiHondurasHong KongHungaryIndiaIndonesiaIranIraqIrelandIsraelItalyJamaicaJapanJordanKazakhstanKenyaKoreaKuwaitLaosLatin AmericaLatviaLebanonLiberiaLithuaniaMalaysiaMexicoMicronesiaMiddle AfricaMoldovaMoroccoNepalNetherlandsNicaraguaNigeriaNorth AmericaNorth MacedoniaNorthern AfricaNorthern EuropeNorwayOceaniaPakistanPanamaPeruPhilippinesPolandPortugalRomaniaRussiaSaudi ArabiaScotlandSenegalSerbiaSierra LeoneSingaporeSomaliaSouth AfricaSouth AmericaSouth Central AsiaSouth Eastern AsiaSouthern EuropeSpainSri LankaSt. Vincent and the GrenadinesSudanSwedenSwitzerlandSyriaTaiwanThailandTrinidad and TobagoTurkeyUgandaUkraineUruguayUzbekistanVenezuelaVietnamWest IndiesWestern AfricaWestern AsiaWestern EuropeYemenZaireZimbabweAzores
Austrian
Race
Ancestry
AfghanAfricanAlaska NativeAlaskan AthabascanAlbanianAleutAlsatianAmericanApacheArabArapahoArgentineanArmenianAssyrian/Chaldean/SyriacAustralianAustrianBahamianBangladeshiBarbadianBasqueBelgianBelizeanBermudanBhutaneseBlackfeetBolivianBrazilianBritishBritish West IndianBulgarianBurmeseCajunCambodianCanadianCape VerdeanCarpatho RusynCelticCentral AmericanCentral American IndianCherokeeCheyenneChickasawChileanChineseChippewaChoctawColombianColvilleComancheCosta RicanCreeCreekCroatianCrowCubanCypriotCzechCzechoslovakianDanishDelawareDominicanDutchDutch West IndianEastern EuropeanEcuadorianEgyptianEnglishEstonianEthiopianEuropeanFijianFilipinoFinnishFrenchFrench American IndianFrench CanadianGermanGerman RussianGhanaianGreekGuamanian/ChamorroGuatemalanGuyaneseHaitianHmongHonduranHopiHoumaHungarianIcelanderIndian (Asian)IndonesianInupiatIranianIraqiIrishIroquoisIsraeliItalianJamaicanJapaneseJordanianKenyanKiowaKoreanLaotianLatvianLebaneseLiberianLithuanianLumbeeLuxembourgerMacedonianMalaysianMalteseMarshalleseMenomineeMexicanMexican American IndianMongolianMoroccanNative HawaiianNavajoNepaleseNew ZealanderNicaraguanNigerianNorthern EuropeanNorwegianOkinawanOsageOttawaPaiutePakistaniPalestinianPanamanianParaguayanPennsylvania GermanPeruvianPimaPolishPortuguesePotawatomiPuebloPuerto RicanPuget Sound SalishRomanianRussianSalvadoranSamoanScandinavianScotch-IrishScottishSeminoleSenegaleseSerbianShoshoneSierra LeoneanSiouxSlavicSlovakSloveneSomaliSouth AfricanSouth AmericanSouth American IndianSoviet UnionSpaniardSpanishSpanish AmericanSpanish American IndianSri LankanSubsaharan AfricanSudaneseSwedishSwissSyrianTaiwaneseThaiTlingit-HaidaTohono O'OdhamTonganTrinidadian and TobagonianTsimshianTurkishU.S. Virgin IslanderUgandanUkrainianUruguayanUteVenezuelanVietnameseWelshWest IndianYakamaYaquiYugoslavianYumanZimbabwean
Immigration
NonimmigrantsImmigrantsAfghanistanAfricaAlbaniaArgentinaArmeniaAsiaAustraliaAustriaBahamasBangladeshBarbadosBelarusBelgiumBelizeBoliviaBosnia and HerzegovinaBrazilBulgariaBurma/MyanmarCabo VerdeCambodiaCameroonCanadaCaribbeanCentral AmericaChileChinaColombiaCongoCosta RicaCroatiaCubaCzechoslovakiaDenmarkDominicaDominican RepublicEastern AfricaEastern AsiaEastern EuropeEcuadorEgyptEl SalvadorEnglandEritreaEthiopiaEuropeFijiFranceGermanyGhanaGreeceGrenadaGuatemalaGuyanaHaitiHondurasHong KongHungaryIndiaIndonesiaIranIraqIrelandIsraelItalyJamaicaJapanJordanKazakhstanKenyaKoreaKuwaitLaosLatin AmericaLatviaLebanonLiberiaLithuaniaMalaysiaMexicoMicronesiaMiddle AfricaMoldovaMoroccoNepalNetherlandsNicaraguaNigeriaNorth AmericaNorth MacedoniaNorthern AfricaNorthern EuropeNorwayOceaniaPakistanPanamaPeruPhilippinesPolandPortugalRomaniaRussiaSaudi ArabiaScotlandSenegalSerbiaSierra LeoneSingaporeSomaliaSouth AfricaSouth AmericaSouth Central AsiaSouth Eastern AsiaSouthern EuropeSpainSri LankaSt. Vincent and the GrenadinesSudanSwedenSwitzerlandSyriaTaiwanThailandTrinidad and TobagoTurkeyUgandaUkraineUruguayUzbekistanVenezuelaVietnamWest IndiesWestern AfricaWestern AsiaWestern EuropeYemenZaireZimbabweAzores
Per Capita Income
Income
Poverty
Unemployment
Labor Participation
Family Structure
Vehicle Availability
Education Level
Disability

Per Capita Income Comparison

Yup'ik

Austrians

Tragic
Exceptional
$30,518
PER CAPITA INCOME
0.0/ 100
METRIC RATING
344th/ 347
METRIC RANK
$48,116
PER CAPITA INCOME
99.3/ 100
METRIC RATING
85th/ 347
METRIC RANK

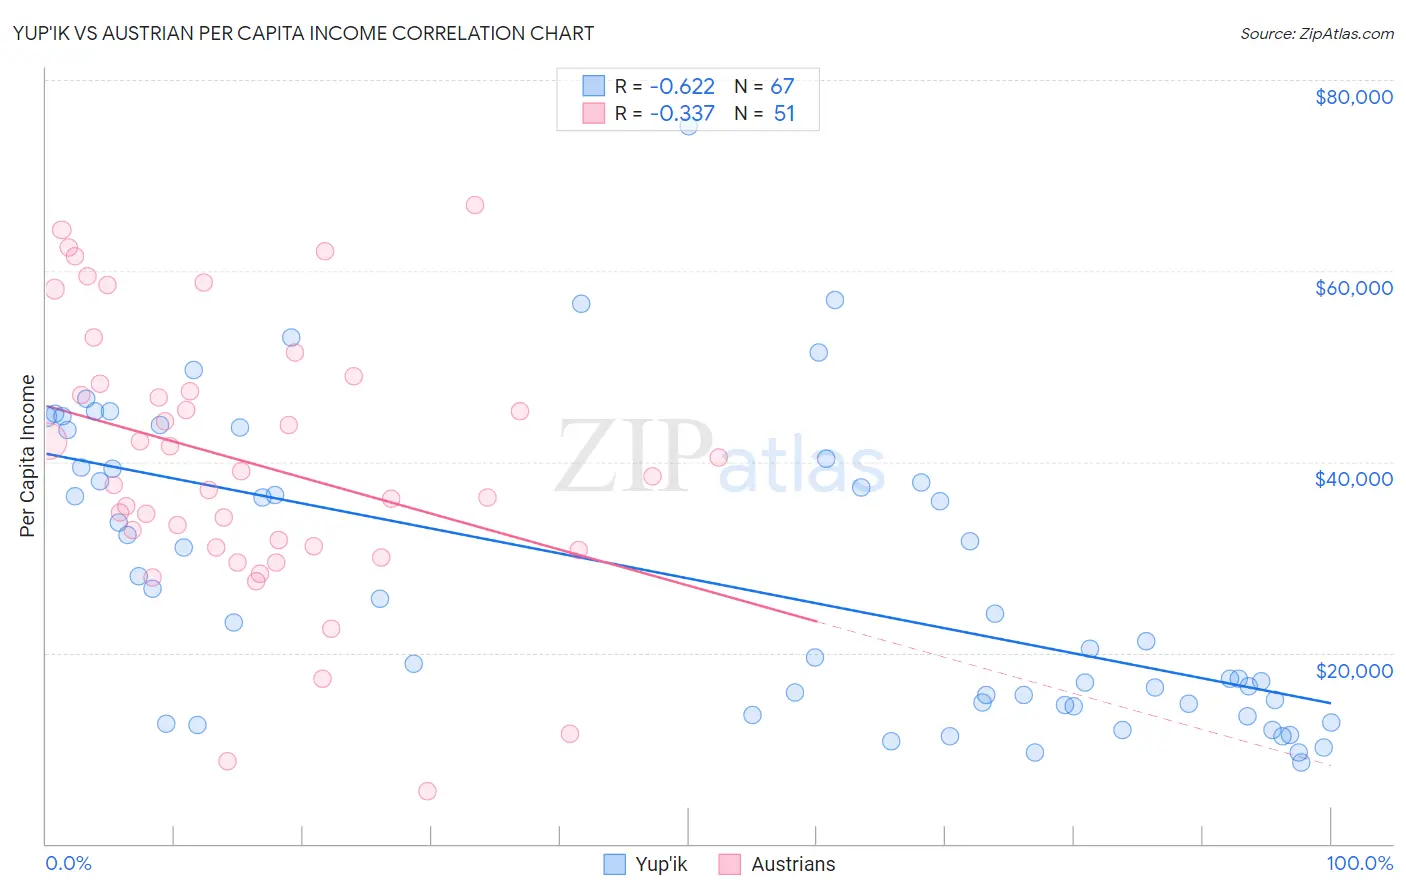
Yup'ik vs Austrian Per Capita Income Correlation Chart

The statistical analysis conducted on geographies consisting of 39,964,789 people shows a significant negative correlation between the proportion of Yup'ik and per capita income in the United States with a correlation coefficient (R) of -0.622 and weighted average of $30,518. Similarly, the statistical analysis conducted on geographies consisting of 452,103,489 people shows a mild negative correlation between the proportion of Austrians and per capita income in the United States with a correlation coefficient (R) of -0.337 and weighted average of $48,116, a difference of 57.7%.
Yup'ik vs Austrian Per Capita Income

Per Capita Income Correlation Summary

MeasurementYup'ikAustrian
Minimum$8,508$5,500
Maximum$75,144$66,908
Range$66,636$61,408
Mean$27,634$39,852
Median$23,141$38,439
Interquartile 25% (IQ1)$14,540$31,067
Interquartile 75% (IQ3)$39,384$48,128
Interquartile Range (IQR)$24,844$17,061
Standard Deviation (Sample)$15,386$14,137
Standard Deviation (Population)$15,271$13,998

Similar Demographics by Per Capita Income

Demographics Similar to Yup'ik by Per Capita Income

In terms of per capita income, the demographic groups most similar to Yup'ik are Pima ($30,644, a difference of 0.41%), Tohono O'odham ($30,256, a difference of 0.87%), Hopi ($31,177, a difference of 2.2%), Lumbee ($29,845, a difference of 2.3%), and Puerto Rican ($31,268, a difference of 2.5%).
DemographicsRating | RankPer Capita Income
Immigrants | Yemen
0.0
/100
|
#333
Tragic
$33,696
Natives/Alaskans
0.0
/100
|
#334
Tragic
$33,279
Yuman
0.0
/100
|
#335
Tragic
$33,236
Yakama
0.0
/100
|
#336
Tragic
$33,009
Houma
0.0
/100
|
#337
Tragic
$32,996
Arapaho
0.0
/100
|
#338
Tragic
$32,345
Pueblo
0.0
/100
|
#339
Tragic
$32,012
Crow
0.0
/100
|
#340
Tragic
$31,729
Puerto Ricans
0.0
/100
|
#341
Tragic
$31,268
Hopi
0.0
/100
|
#342
Tragic
$31,177
Pima
0.0
/100
|
#343
Tragic
$30,644
Yup'ik
0.0
/100
|
#344
Tragic
$30,518
Tohono O'odham
0.0
/100
|
#345
Tragic
$30,256
Lumbee
0.0
/100
|
#346
Tragic
$29,845
Navajo
0.0
/100
|
#347
Tragic
$29,031

Demographics Similar to Austrians by Per Capita Income

In terms of per capita income, the demographic groups most similar to Austrians are Immigrants from Ukraine ($48,134, a difference of 0.040%), Immigrants from Brazil ($48,164, a difference of 0.10%), Immigrants from Indonesia ($48,195, a difference of 0.16%), Immigrants from Southern Europe ($48,027, a difference of 0.18%), and Ukrainian ($48,014, a difference of 0.21%).
DemographicsRating | RankPer Capita Income
Immigrants | Italy
99.6
/100
|
#78
Exceptional
$48,654
Romanians
99.5
/100
|
#79
Exceptional
$48,445
Egyptians
99.5
/100
|
#80
Exceptional
$48,358
Armenians
99.4
/100
|
#81
Exceptional
$48,287
Immigrants | Indonesia
99.4
/100
|
#82
Exceptional
$48,195
Immigrants | Brazil
99.4
/100
|
#83
Exceptional
$48,164
Immigrants | Ukraine
99.3
/100
|
#84
Exceptional
$48,134
Austrians
99.3
/100
|
#85
Exceptional
$48,116
Immigrants | Southern Europe
99.3
/100
|
#86
Exceptional
$48,027
Ukrainians
99.3
/100
|
#87
Exceptional
$48,014
Croatians
99.0
/100
|
#88
Exceptional
$47,742
Northern Europeans
98.9
/100
|
#89
Exceptional
$47,698
Italians
98.8
/100
|
#90
Exceptional
$47,574
Macedonians
98.8
/100
|
#91
Exceptional
$47,573
Immigrants | Moldova
98.7
/100
|
#92
Exceptional
$47,489