Latvian vs Greek Householder Income Ages 45 - 64 years
COMPARE
Latvian
Greek
Householder Income Ages 45 - 64 years
Householder Income Ages 45 - 64 years Comparison
Latvians
Greeks
$115,957
HOUSEHOLDER INCOME AGES 45 - 64 YEARS
100.0/ 100
METRIC RATING
35th/ 347
METRIC RANK
$112,630
HOUSEHOLDER INCOME AGES 45 - 64 YEARS
99.8/ 100
METRIC RATING
54th/ 347
METRIC RANK
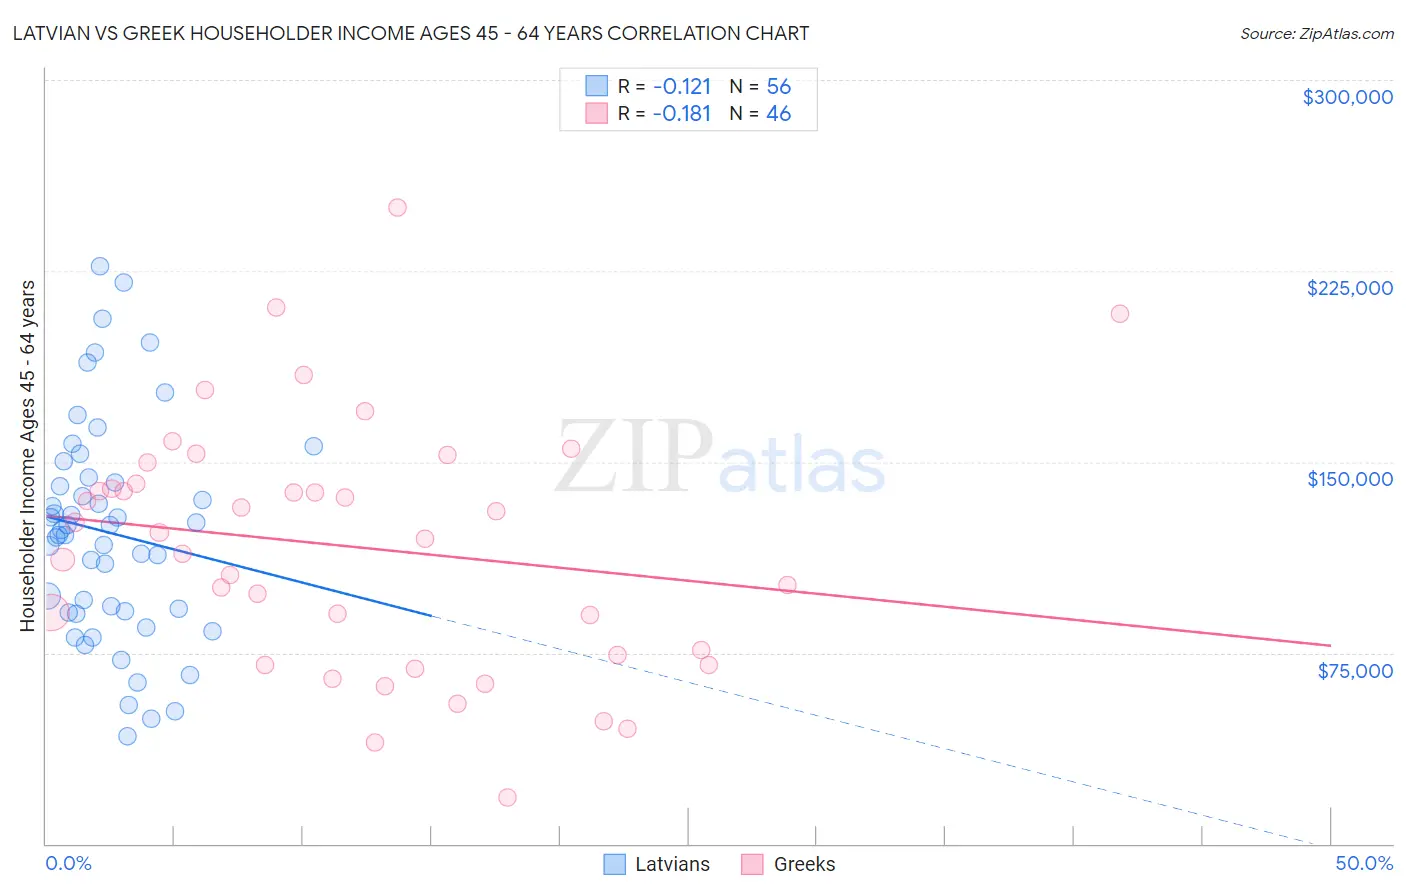
Latvian vs Greek Householder Income Ages 45 - 64 years Correlation Chart
The statistical analysis conducted on geographies consisting of 220,551,623 people shows a poor negative correlation between the proportion of Latvians and household income with householder between the ages 45 and 64 in the United States with a correlation coefficient (R) of -0.121 and weighted average of $115,957. Similarly, the statistical analysis conducted on geographies consisting of 481,485,565 people shows a poor negative correlation between the proportion of Greeks and household income with householder between the ages 45 and 64 in the United States with a correlation coefficient (R) of -0.181 and weighted average of $112,630, a difference of 2.9%.
Householder Income Ages 45 - 64 years Correlation Summary
| Measurement | Latvian | Greek |
| Minimum | $42,308 | $18,083 |
| Maximum | $227,065 | $250,001 |
| Range | $184,757 | $231,918 |
| Mean | $122,178 | $116,578 |
| Median | $122,376 | $121,059 |
| Interquartile 25% (IQ1) | $90,966 | $74,375 |
| Interquartile 75% (IQ3) | $143,031 | $141,576 |
| Interquartile Range (IQR) | $52,065 | $67,201 |
| Standard Deviation (Sample) | $42,820 | $49,084 |
| Standard Deviation (Population) | $42,436 | $48,548 |
Demographics Similar to Latvians and Greeks by Householder Income Ages 45 - 64 years
In terms of householder income ages 45 - 64 years, the demographic groups most similar to Latvians are Immigrants from Switzerland ($115,934, a difference of 0.020%), Immigrants from Denmark ($116,000, a difference of 0.040%), Maltese ($114,754, a difference of 1.1%), Immigrants from Pakistan ($114,434, a difference of 1.3%), and Immigrants from Turkey ($114,407, a difference of 1.3%). Similarly, the demographic groups most similar to Greeks are Afghan ($112,676, a difference of 0.040%), Immigrants from Malaysia ($112,796, a difference of 0.15%), Immigrants from South Africa ($112,886, a difference of 0.23%), Immigrants from Austria ($113,140, a difference of 0.45%), and Immigrants from Russia ($113,215, a difference of 0.52%).
| Demographics | Rating | Rank | Householder Income Ages 45 - 64 years |
| Immigrants | Denmark | 100.0 /100 | #34 | Exceptional $116,000 |
| Latvians | 100.0 /100 | #35 | Exceptional $115,957 |
| Immigrants | Switzerland | 100.0 /100 | #36 | Exceptional $115,934 |
| Maltese | 99.9 /100 | #37 | Exceptional $114,754 |
| Immigrants | Pakistan | 99.9 /100 | #38 | Exceptional $114,434 |
| Immigrants | Turkey | 99.9 /100 | #39 | Exceptional $114,407 |
| Cambodians | 99.9 /100 | #40 | Exceptional $114,342 |
| Immigrants | Lithuania | 99.9 /100 | #41 | Exceptional $114,336 |
| Estonians | 99.9 /100 | #42 | Exceptional $114,220 |
| Israelis | 99.9 /100 | #43 | Exceptional $114,186 |
| Bulgarians | 99.9 /100 | #44 | Exceptional $113,883 |
| Immigrants | France | 99.9 /100 | #45 | Exceptional $113,680 |
| Immigrants | Greece | 99.9 /100 | #46 | Exceptional $113,548 |
| Australians | 99.9 /100 | #47 | Exceptional $113,533 |
| Immigrants | Indonesia | 99.9 /100 | #48 | Exceptional $113,519 |
| Immigrants | Russia | 99.8 /100 | #49 | Exceptional $113,215 |
| Immigrants | Austria | 99.8 /100 | #50 | Exceptional $113,140 |
| Immigrants | South Africa | 99.8 /100 | #51 | Exceptional $112,886 |
| Immigrants | Malaysia | 99.8 /100 | #52 | Exceptional $112,796 |
| Afghans | 99.8 /100 | #53 | Exceptional $112,676 |
| Greeks | 99.8 /100 | #54 | Exceptional $112,630 |