Cuban vs Greek Householder Income Ages 45 - 64 years
COMPARE
Cuban
Greek
Householder Income Ages 45 - 64 years
Householder Income Ages 45 - 64 years Comparison
Cubans
Greeks
$86,301
HOUSEHOLDER INCOME AGES 45 - 64 YEARS
0.1/ 100
METRIC RATING
289th/ 347
METRIC RANK
$112,630
HOUSEHOLDER INCOME AGES 45 - 64 YEARS
99.8/ 100
METRIC RATING
54th/ 347
METRIC RANK
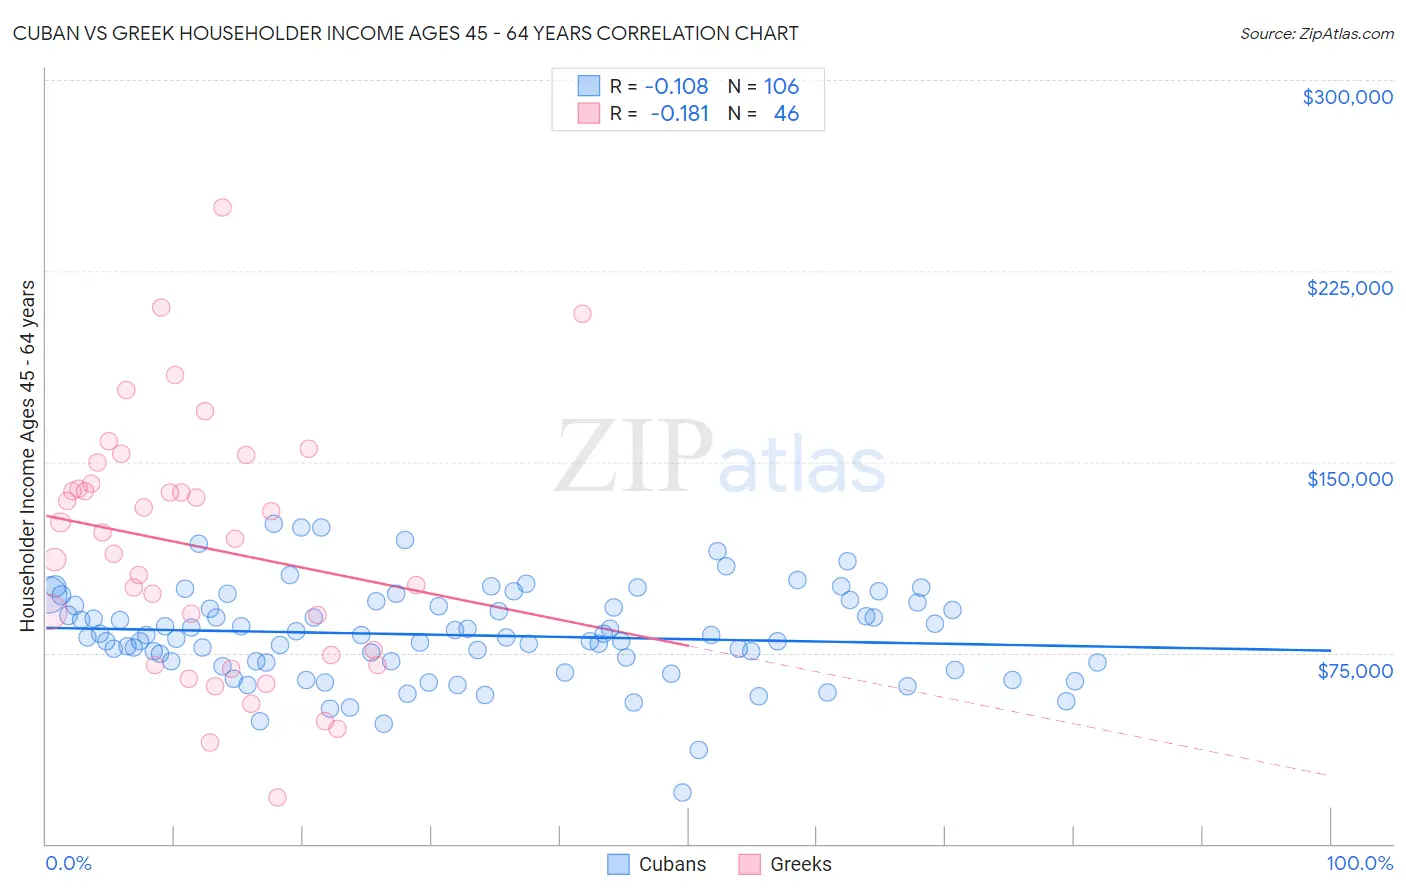
Cuban vs Greek Householder Income Ages 45 - 64 years Correlation Chart
The statistical analysis conducted on geographies consisting of 448,142,263 people shows a poor negative correlation between the proportion of Cubans and household income with householder between the ages 45 and 64 in the United States with a correlation coefficient (R) of -0.108 and weighted average of $86,301. Similarly, the statistical analysis conducted on geographies consisting of 481,485,565 people shows a poor negative correlation between the proportion of Greeks and household income with householder between the ages 45 and 64 in the United States with a correlation coefficient (R) of -0.181 and weighted average of $112,630, a difference of 30.5%.
Householder Income Ages 45 - 64 years Correlation Summary
| Measurement | Cuban | Greek |
| Minimum | $20,329 | $18,083 |
| Maximum | $125,619 | $250,001 |
| Range | $105,290 | $231,918 |
| Mean | $81,965 | $116,578 |
| Median | $81,610 | $121,059 |
| Interquartile 25% (IQ1) | $71,341 | $74,375 |
| Interquartile 75% (IQ3) | $93,648 | $141,576 |
| Interquartile Range (IQR) | $22,307 | $67,201 |
| Standard Deviation (Sample) | $18,497 | $49,084 |
| Standard Deviation (Population) | $18,410 | $48,548 |
Similar Demographics by Householder Income Ages 45 - 64 years
Demographics Similar to Cubans by Householder Income Ages 45 - 64 years
In terms of householder income ages 45 - 64 years, the demographic groups most similar to Cubans are Immigrants from St. Vincent and the Grenadines ($86,394, a difference of 0.11%), Bangladeshi ($86,402, a difference of 0.12%), Cherokee ($86,125, a difference of 0.20%), Immigrants from Guatemala ($86,573, a difference of 0.32%), and Blackfeet ($86,595, a difference of 0.34%).
| Demographics | Rating | Rank | Householder Income Ages 45 - 64 years |
| Senegalese | 0.1 /100 | #282 | Tragic $86,897 |
| Mexicans | 0.1 /100 | #283 | Tragic $86,816 |
| Central American Indians | 0.1 /100 | #284 | Tragic $86,764 |
| Blackfeet | 0.1 /100 | #285 | Tragic $86,595 |
| Immigrants | Guatemala | 0.1 /100 | #286 | Tragic $86,573 |
| Bangladeshis | 0.1 /100 | #287 | Tragic $86,402 |
| Immigrants | St. Vincent and the Grenadines | 0.1 /100 | #288 | Tragic $86,394 |
| Cubans | 0.1 /100 | #289 | Tragic $86,301 |
| Cherokee | 0.1 /100 | #290 | Tragic $86,125 |
| Hispanics or Latinos | 0.1 /100 | #291 | Tragic $86,006 |
| Immigrants | Central America | 0.1 /100 | #292 | Tragic $85,965 |
| Comanche | 0.1 /100 | #293 | Tragic $85,787 |
| British West Indians | 0.1 /100 | #294 | Tragic $85,571 |
| Immigrants | Grenada | 0.1 /100 | #295 | Tragic $85,552 |
| Immigrants | Zaire | 0.1 /100 | #296 | Tragic $85,207 |
Demographics Similar to Greeks by Householder Income Ages 45 - 64 years
In terms of householder income ages 45 - 64 years, the demographic groups most similar to Greeks are Afghan ($112,676, a difference of 0.040%), Lithuanian ($112,484, a difference of 0.13%), Immigrants from Malaysia ($112,796, a difference of 0.15%), Immigrants from South Africa ($112,886, a difference of 0.23%), and Egyptian ($112,256, a difference of 0.33%).
| Demographics | Rating | Rank | Householder Income Ages 45 - 64 years |
| Australians | 99.9 /100 | #47 | Exceptional $113,533 |
| Immigrants | Indonesia | 99.9 /100 | #48 | Exceptional $113,519 |
| Immigrants | Russia | 99.8 /100 | #49 | Exceptional $113,215 |
| Immigrants | Austria | 99.8 /100 | #50 | Exceptional $113,140 |
| Immigrants | South Africa | 99.8 /100 | #51 | Exceptional $112,886 |
| Immigrants | Malaysia | 99.8 /100 | #52 | Exceptional $112,796 |
| Afghans | 99.8 /100 | #53 | Exceptional $112,676 |
| Greeks | 99.8 /100 | #54 | Exceptional $112,630 |
| Lithuanians | 99.8 /100 | #55 | Exceptional $112,484 |
| Egyptians | 99.7 /100 | #56 | Exceptional $112,256 |
| Immigrants | Scotland | 99.7 /100 | #57 | Exceptional $112,175 |
| Soviet Union | 99.7 /100 | #58 | Exceptional $112,008 |
| Immigrants | Europe | 99.7 /100 | #59 | Exceptional $111,984 |
| Immigrants | Netherlands | 99.7 /100 | #60 | Exceptional $111,982 |
| Immigrants | Czechoslovakia | 99.7 /100 | #61 | Exceptional $111,914 |