Yuman vs Uruguayan Householder Income Ages 25 - 44 years
COMPARE
Yuman
Uruguayan
Householder Income Ages 25 - 44 years
Householder Income Ages 25 - 44 years Comparison
Yuman
Uruguayans
$72,956
HOUSEHOLDER INCOME AGES 25 - 44 YEARS
0.0/ 100
METRIC RATING
339th/ 347
METRIC RANK
$93,631
HOUSEHOLDER INCOME AGES 25 - 44 YEARS
37.3/ 100
METRIC RATING
182nd/ 347
METRIC RANK
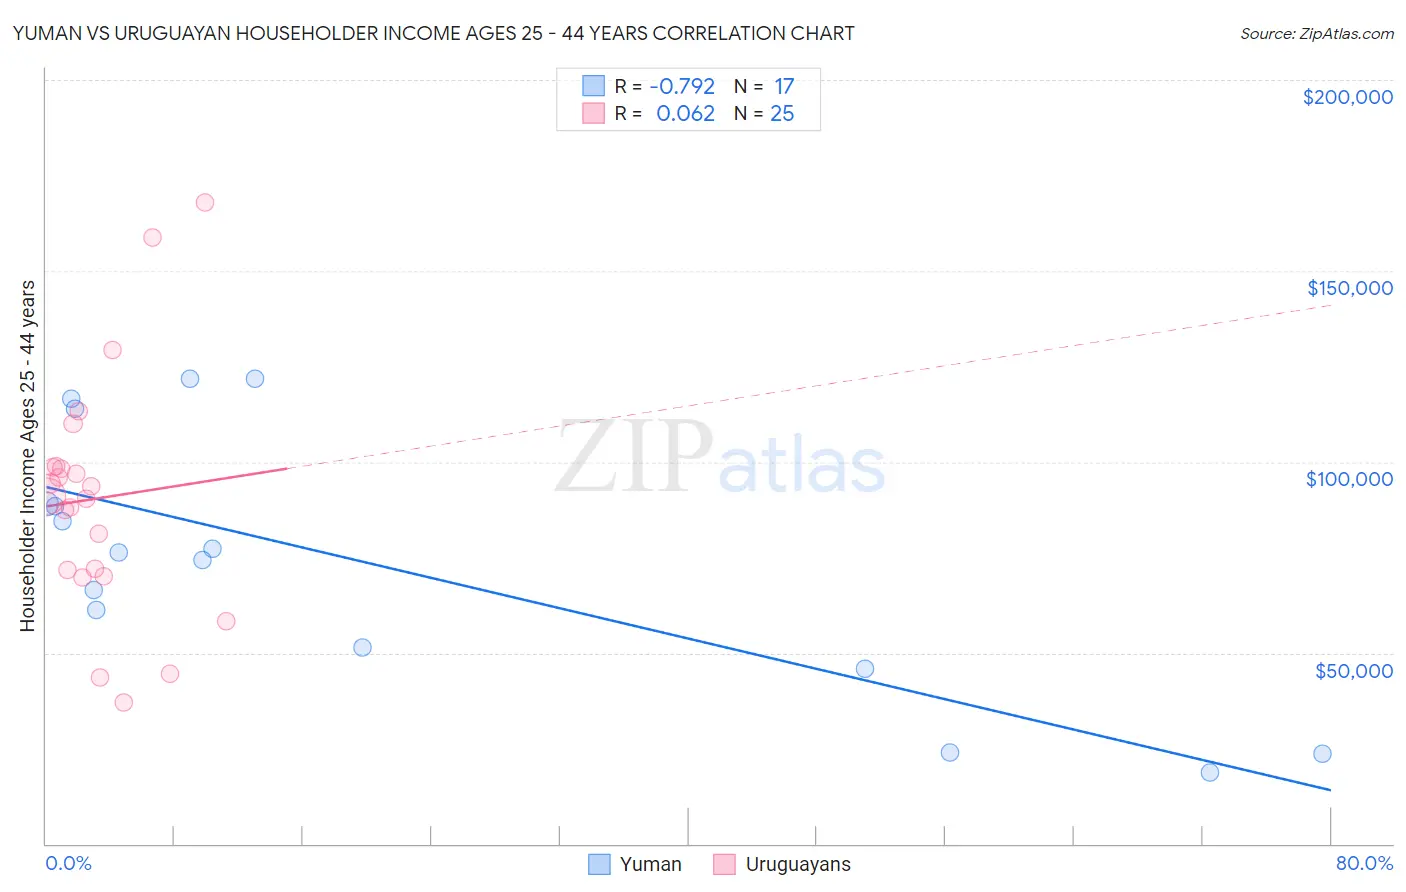
Yuman vs Uruguayan Householder Income Ages 25 - 44 years Correlation Chart
The statistical analysis conducted on geographies consisting of 40,597,364 people shows a strong negative correlation between the proportion of Yuman and household income with householder between the ages 25 and 44 in the United States with a correlation coefficient (R) of -0.792 and weighted average of $72,956. Similarly, the statistical analysis conducted on geographies consisting of 144,694,507 people shows a slight positive correlation between the proportion of Uruguayans and household income with householder between the ages 25 and 44 in the United States with a correlation coefficient (R) of 0.062 and weighted average of $93,631, a difference of 28.3%.
Householder Income Ages 25 - 44 years Correlation Summary
| Measurement | Yuman | Uruguayan |
| Minimum | $18,542 | $36,875 |
| Maximum | $121,667 | $167,820 |
| Range | $103,125 | $130,945 |
| Mean | $73,782 | $90,398 |
| Median | $76,250 | $91,039 |
| Interquartile 25% (IQ1) | $48,591 | $70,777 |
| Interquartile 75% (IQ3) | $101,410 | $98,813 |
| Interquartile Range (IQR) | $52,819 | $28,036 |
| Standard Deviation (Sample) | $33,681 | $31,106 |
| Standard Deviation (Population) | $32,676 | $30,478 |
Similar Demographics by Householder Income Ages 25 - 44 years
Demographics Similar to Yuman by Householder Income Ages 25 - 44 years
In terms of householder income ages 25 - 44 years, the demographic groups most similar to Yuman are Immigrants from Yemen ($73,043, a difference of 0.12%), Black/African American ($73,370, a difference of 0.57%), Yup'ik ($73,688, a difference of 1.0%), Immigrants from Congo ($72,178, a difference of 1.1%), and Arapaho ($71,697, a difference of 1.8%).
| Demographics | Rating | Rank | Householder Income Ages 25 - 44 years |
| Bahamians | 0.0 /100 | #332 | Tragic $75,395 |
| Hopi | 0.0 /100 | #333 | Tragic $75,002 |
| Creek | 0.0 /100 | #334 | Tragic $74,847 |
| Kiowa | 0.0 /100 | #335 | Tragic $74,776 |
| Yup'ik | 0.0 /100 | #336 | Tragic $73,688 |
| Blacks/African Americans | 0.0 /100 | #337 | Tragic $73,370 |
| Immigrants | Yemen | 0.0 /100 | #338 | Tragic $73,043 |
| Yuman | 0.0 /100 | #339 | Tragic $72,956 |
| Immigrants | Congo | 0.0 /100 | #340 | Tragic $72,178 |
| Arapaho | 0.0 /100 | #341 | Tragic $71,697 |
| Crow | 0.0 /100 | #342 | Tragic $71,337 |
| Tohono O'odham | 0.0 /100 | #343 | Tragic $69,068 |
| Pueblo | 0.0 /100 | #344 | Tragic $68,910 |
| Navajo | 0.0 /100 | #345 | Tragic $66,529 |
| Puerto Ricans | 0.0 /100 | #346 | Tragic $65,996 |
Demographics Similar to Uruguayans by Householder Income Ages 25 - 44 years
In terms of householder income ages 25 - 44 years, the demographic groups most similar to Uruguayans are Puget Sound Salish ($93,661, a difference of 0.030%), French ($93,665, a difference of 0.040%), French Canadian ($93,694, a difference of 0.070%), Guamanian/Chamorro ($93,569, a difference of 0.070%), and German ($93,531, a difference of 0.11%).
| Demographics | Rating | Rank | Householder Income Ages 25 - 44 years |
| English | 48.1 /100 | #175 | Average $94,429 |
| Immigrants | Immigrants | 48.0 /100 | #176 | Average $94,423 |
| Belgians | 45.8 /100 | #177 | Average $94,262 |
| Immigrants | South America | 42.8 /100 | #178 | Average $94,042 |
| French Canadians | 38.2 /100 | #179 | Fair $93,694 |
| French | 37.8 /100 | #180 | Fair $93,665 |
| Puget Sound Salish | 37.7 /100 | #181 | Fair $93,661 |
| Uruguayans | 37.3 /100 | #182 | Fair $93,631 |
| Guamanians/Chamorros | 36.5 /100 | #183 | Fair $93,569 |
| Germans | 36.0 /100 | #184 | Fair $93,531 |
| Immigrants | Eritrea | 35.2 /100 | #185 | Fair $93,466 |
| Sierra Leoneans | 34.8 /100 | #186 | Fair $93,435 |
| Spaniards | 34.0 /100 | #187 | Fair $93,366 |
| Immigrants | Sierra Leone | 30.9 /100 | #188 | Fair $93,115 |
| Dutch | 30.5 /100 | #189 | Fair $93,081 |