Yuman vs Dominican Householder Income Ages 25 - 44 years
COMPARE
Yuman
Dominican
Householder Income Ages 25 - 44 years
Householder Income Ages 25 - 44 years Comparison
Yuman
Dominicans
$72,956
HOUSEHOLDER INCOME AGES 25 - 44 YEARS
0.0/ 100
METRIC RATING
339th/ 347
METRIC RANK
$81,229
HOUSEHOLDER INCOME AGES 25 - 44 YEARS
0.1/ 100
METRIC RATING
298th/ 347
METRIC RANK
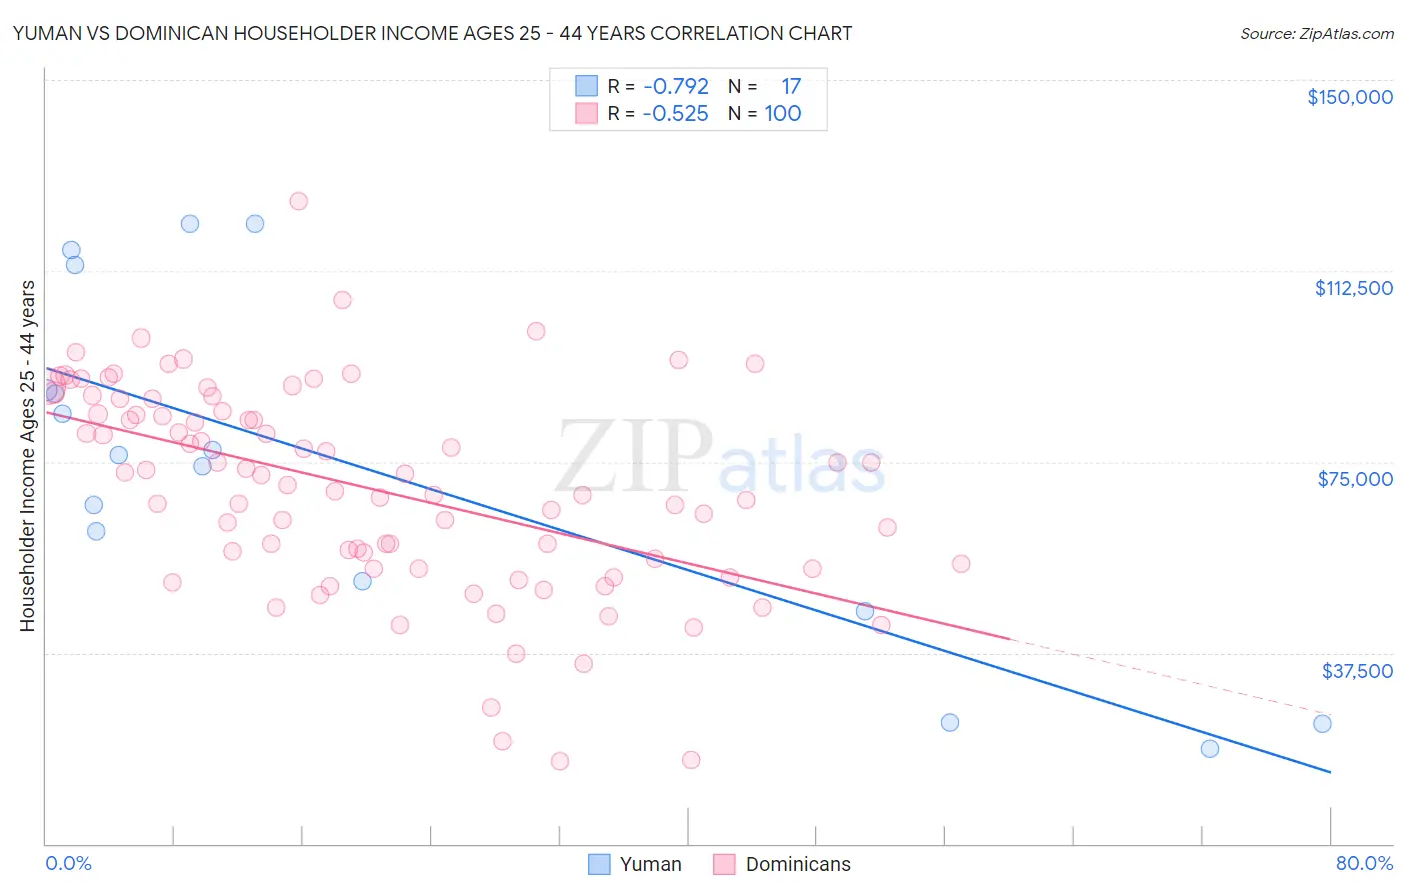
Yuman vs Dominican Householder Income Ages 25 - 44 years Correlation Chart
The statistical analysis conducted on geographies consisting of 40,597,364 people shows a strong negative correlation between the proportion of Yuman and household income with householder between the ages 25 and 44 in the United States with a correlation coefficient (R) of -0.792 and weighted average of $72,956. Similarly, the statistical analysis conducted on geographies consisting of 354,179,594 people shows a substantial negative correlation between the proportion of Dominicans and household income with householder between the ages 25 and 44 in the United States with a correlation coefficient (R) of -0.525 and weighted average of $81,229, a difference of 11.3%.
Householder Income Ages 25 - 44 years Correlation Summary
| Measurement | Yuman | Dominican |
| Minimum | $18,542 | $16,282 |
| Maximum | $121,667 | $126,257 |
| Range | $103,125 | $109,975 |
| Mean | $73,782 | $69,757 |
| Median | $76,250 | $71,447 |
| Interquartile 25% (IQ1) | $48,591 | $54,470 |
| Interquartile 75% (IQ3) | $101,410 | $86,209 |
| Interquartile Range (IQR) | $52,819 | $31,740 |
| Standard Deviation (Sample) | $33,681 | $20,437 |
| Standard Deviation (Population) | $32,676 | $20,334 |
Similar Demographics by Householder Income Ages 25 - 44 years
Demographics Similar to Yuman by Householder Income Ages 25 - 44 years
In terms of householder income ages 25 - 44 years, the demographic groups most similar to Yuman are Immigrants from Yemen ($73,043, a difference of 0.12%), Black/African American ($73,370, a difference of 0.57%), Yup'ik ($73,688, a difference of 1.0%), Immigrants from Congo ($72,178, a difference of 1.1%), and Arapaho ($71,697, a difference of 1.8%).
| Demographics | Rating | Rank | Householder Income Ages 25 - 44 years |
| Bahamians | 0.0 /100 | #332 | Tragic $75,395 |
| Hopi | 0.0 /100 | #333 | Tragic $75,002 |
| Creek | 0.0 /100 | #334 | Tragic $74,847 |
| Kiowa | 0.0 /100 | #335 | Tragic $74,776 |
| Yup'ik | 0.0 /100 | #336 | Tragic $73,688 |
| Blacks/African Americans | 0.0 /100 | #337 | Tragic $73,370 |
| Immigrants | Yemen | 0.0 /100 | #338 | Tragic $73,043 |
| Yuman | 0.0 /100 | #339 | Tragic $72,956 |
| Immigrants | Congo | 0.0 /100 | #340 | Tragic $72,178 |
| Arapaho | 0.0 /100 | #341 | Tragic $71,697 |
| Crow | 0.0 /100 | #342 | Tragic $71,337 |
| Tohono O'odham | 0.0 /100 | #343 | Tragic $69,068 |
| Pueblo | 0.0 /100 | #344 | Tragic $68,910 |
| Navajo | 0.0 /100 | #345 | Tragic $66,529 |
| Puerto Ricans | 0.0 /100 | #346 | Tragic $65,996 |
Demographics Similar to Dominicans by Householder Income Ages 25 - 44 years
In terms of householder income ages 25 - 44 years, the demographic groups most similar to Dominicans are Immigrants from Guatemala ($81,341, a difference of 0.14%), Immigrants from Dominica ($81,351, a difference of 0.15%), Bangladeshi ($81,363, a difference of 0.17%), Cuban ($81,483, a difference of 0.31%), and Blackfeet ($81,531, a difference of 0.37%).
| Demographics | Rating | Rank | Householder Income Ages 25 - 44 years |
| Potawatomi | 0.1 /100 | #291 | Tragic $81,774 |
| Yaqui | 0.1 /100 | #292 | Tragic $81,656 |
| Blackfeet | 0.1 /100 | #293 | Tragic $81,531 |
| Cubans | 0.1 /100 | #294 | Tragic $81,483 |
| Bangladeshis | 0.1 /100 | #295 | Tragic $81,363 |
| Immigrants | Dominica | 0.1 /100 | #296 | Tragic $81,351 |
| Immigrants | Guatemala | 0.1 /100 | #297 | Tragic $81,341 |
| Dominicans | 0.1 /100 | #298 | Tragic $81,229 |
| Immigrants | Liberia | 0.1 /100 | #299 | Tragic $80,863 |
| Cherokee | 0.0 /100 | #300 | Tragic $80,843 |
| Immigrants | Micronesia | 0.0 /100 | #301 | Tragic $80,544 |
| Hispanics or Latinos | 0.0 /100 | #302 | Tragic $80,515 |
| Mexicans | 0.0 /100 | #303 | Tragic $80,427 |
| Immigrants | Caribbean | 0.0 /100 | #304 | Tragic $80,326 |
| Immigrants | Dominican Republic | 0.0 /100 | #305 | Tragic $80,319 |