Greek vs Uruguayan Householder Income Ages 25 - 44 years
COMPARE
Greek
Uruguayan
Householder Income Ages 25 - 44 years
Householder Income Ages 25 - 44 years Comparison
Greeks
Uruguayans
$106,457
HOUSEHOLDER INCOME AGES 25 - 44 YEARS
99.9/ 100
METRIC RATING
55th/ 347
METRIC RANK
$93,631
HOUSEHOLDER INCOME AGES 25 - 44 YEARS
37.3/ 100
METRIC RATING
182nd/ 347
METRIC RANK
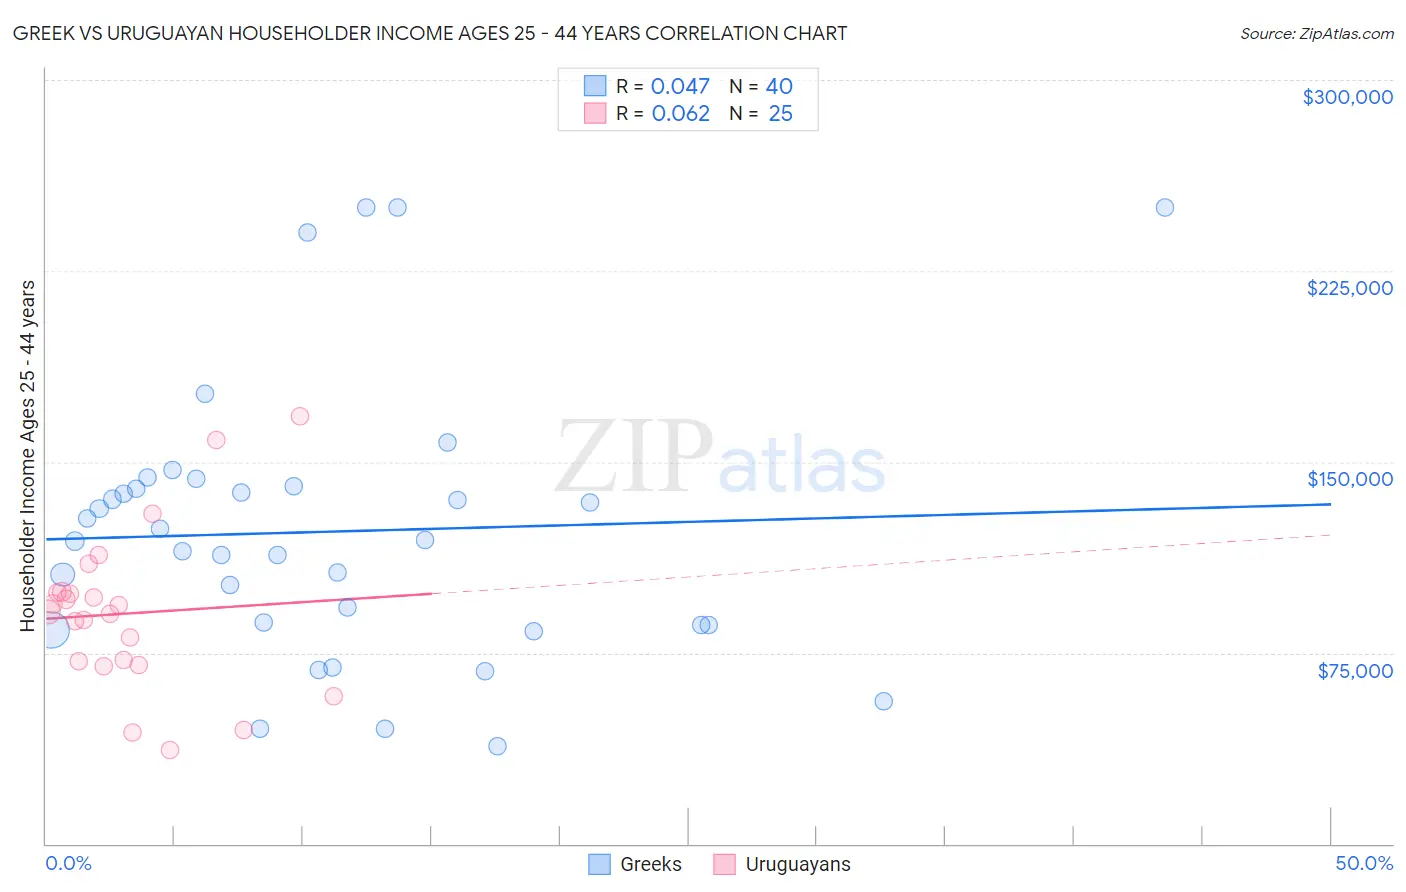
Greek vs Uruguayan Householder Income Ages 25 - 44 years Correlation Chart
The statistical analysis conducted on geographies consisting of 480,636,486 people shows no correlation between the proportion of Greeks and household income with householder between the ages 25 and 44 in the United States with a correlation coefficient (R) of 0.047 and weighted average of $106,457. Similarly, the statistical analysis conducted on geographies consisting of 144,694,507 people shows a slight positive correlation between the proportion of Uruguayans and household income with householder between the ages 25 and 44 in the United States with a correlation coefficient (R) of 0.062 and weighted average of $93,631, a difference of 13.7%.
Householder Income Ages 25 - 44 years Correlation Summary
| Measurement | Greek | Uruguayan |
| Minimum | $38,250 | $36,875 |
| Maximum | $250,001 | $167,820 |
| Range | $211,751 | $130,945 |
| Mean | $122,593 | $90,398 |
| Median | $119,219 | $91,039 |
| Interquartile 25% (IQ1) | $85,764 | $70,777 |
| Interquartile 75% (IQ3) | $139,981 | $98,813 |
| Interquartile Range (IQR) | $54,217 | $28,036 |
| Standard Deviation (Sample) | $53,394 | $31,106 |
| Standard Deviation (Population) | $52,723 | $30,478 |
Similar Demographics by Householder Income Ages 25 - 44 years
Demographics Similar to Greeks by Householder Income Ages 25 - 44 years
In terms of householder income ages 25 - 44 years, the demographic groups most similar to Greeks are Paraguayan ($106,615, a difference of 0.15%), Immigrants from Norway ($106,629, a difference of 0.16%), Immigrants from Pakistan ($106,129, a difference of 0.31%), Immigrants from Austria ($106,103, a difference of 0.33%), and Immigrants from Europe ($106,817, a difference of 0.34%).
| Demographics | Rating | Rank | Householder Income Ages 25 - 44 years |
| Bulgarians | 99.9 /100 | #48 | Exceptional $107,264 |
| Immigrants | Turkey | 99.9 /100 | #49 | Exceptional $107,258 |
| Cambodians | 99.9 /100 | #50 | Exceptional $107,148 |
| Immigrants | Czechoslovakia | 99.9 /100 | #51 | Exceptional $106,888 |
| Immigrants | Europe | 99.9 /100 | #52 | Exceptional $106,817 |
| Immigrants | Norway | 99.9 /100 | #53 | Exceptional $106,629 |
| Paraguayans | 99.9 /100 | #54 | Exceptional $106,615 |
| Greeks | 99.9 /100 | #55 | Exceptional $106,457 |
| Immigrants | Pakistan | 99.8 /100 | #56 | Exceptional $106,129 |
| Immigrants | Austria | 99.8 /100 | #57 | Exceptional $106,103 |
| Immigrants | South Africa | 99.8 /100 | #58 | Exceptional $105,748 |
| Immigrants | Latvia | 99.8 /100 | #59 | Exceptional $105,522 |
| Egyptians | 99.7 /100 | #60 | Exceptional $105,282 |
| Lithuanians | 99.7 /100 | #61 | Exceptional $105,223 |
| Immigrants | Italy | 99.7 /100 | #62 | Exceptional $105,201 |
Demographics Similar to Uruguayans by Householder Income Ages 25 - 44 years
In terms of householder income ages 25 - 44 years, the demographic groups most similar to Uruguayans are Puget Sound Salish ($93,661, a difference of 0.030%), French ($93,665, a difference of 0.040%), French Canadian ($93,694, a difference of 0.070%), Guamanian/Chamorro ($93,569, a difference of 0.070%), and German ($93,531, a difference of 0.11%).
| Demographics | Rating | Rank | Householder Income Ages 25 - 44 years |
| English | 48.1 /100 | #175 | Average $94,429 |
| Immigrants | Immigrants | 48.0 /100 | #176 | Average $94,423 |
| Belgians | 45.8 /100 | #177 | Average $94,262 |
| Immigrants | South America | 42.8 /100 | #178 | Average $94,042 |
| French Canadians | 38.2 /100 | #179 | Fair $93,694 |
| French | 37.8 /100 | #180 | Fair $93,665 |
| Puget Sound Salish | 37.7 /100 | #181 | Fair $93,661 |
| Uruguayans | 37.3 /100 | #182 | Fair $93,631 |
| Guamanians/Chamorros | 36.5 /100 | #183 | Fair $93,569 |
| Germans | 36.0 /100 | #184 | Fair $93,531 |
| Immigrants | Eritrea | 35.2 /100 | #185 | Fair $93,466 |
| Sierra Leoneans | 34.8 /100 | #186 | Fair $93,435 |
| Spaniards | 34.0 /100 | #187 | Fair $93,366 |
| Immigrants | Sierra Leone | 30.9 /100 | #188 | Fair $93,115 |
| Dutch | 30.5 /100 | #189 | Fair $93,081 |