Immigrants from Cambodia vs Uruguayan Householder Income Ages 25 - 44 years
COMPARE
Immigrants from Cambodia
Uruguayan
Householder Income Ages 25 - 44 years
Householder Income Ages 25 - 44 years Comparison
Immigrants from Cambodia
Uruguayans
$91,533
HOUSEHOLDER INCOME AGES 25 - 44 YEARS
15.7/ 100
METRIC RATING
203rd/ 347
METRIC RANK
$93,631
HOUSEHOLDER INCOME AGES 25 - 44 YEARS
37.3/ 100
METRIC RATING
182nd/ 347
METRIC RANK
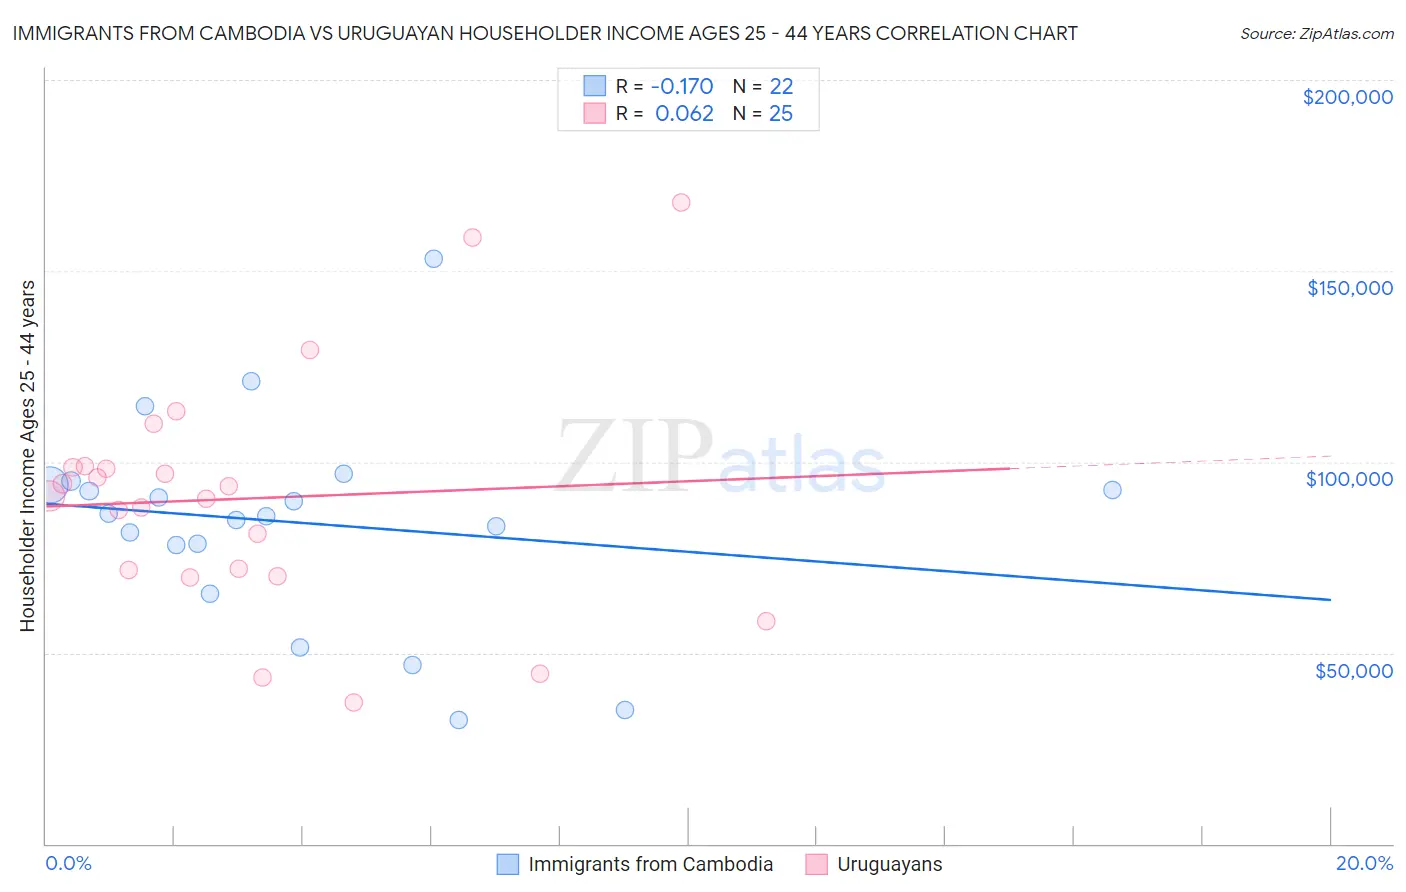
Immigrants from Cambodia vs Uruguayan Householder Income Ages 25 - 44 years Correlation Chart
The statistical analysis conducted on geographies consisting of 205,045,995 people shows a poor negative correlation between the proportion of Immigrants from Cambodia and household income with householder between the ages 25 and 44 in the United States with a correlation coefficient (R) of -0.170 and weighted average of $91,533. Similarly, the statistical analysis conducted on geographies consisting of 144,694,507 people shows a slight positive correlation between the proportion of Uruguayans and household income with householder between the ages 25 and 44 in the United States with a correlation coefficient (R) of 0.062 and weighted average of $93,631, a difference of 2.3%.
Householder Income Ages 25 - 44 years Correlation Summary
| Measurement | Immigrants from Cambodia | Uruguayan |
| Minimum | $32,434 | $36,875 |
| Maximum | $153,083 | $167,820 |
| Range | $120,649 | $130,945 |
| Mean | $84,078 | $90,398 |
| Median | $86,079 | $91,039 |
| Interquartile 25% (IQ1) | $78,256 | $70,777 |
| Interquartile 75% (IQ3) | $93,913 | $98,813 |
| Interquartile Range (IQR) | $15,657 | $28,036 |
| Standard Deviation (Sample) | $27,275 | $31,106 |
| Standard Deviation (Population) | $26,648 | $30,478 |
Similar Demographics by Householder Income Ages 25 - 44 years
Demographics Similar to Immigrants from Cambodia by Householder Income Ages 25 - 44 years
In terms of householder income ages 25 - 44 years, the demographic groups most similar to Immigrants from Cambodia are Ecuadorian ($91,574, a difference of 0.040%), Nepalese ($91,498, a difference of 0.040%), Immigrants from Eastern Africa ($91,458, a difference of 0.080%), Japanese ($91,624, a difference of 0.10%), and White/Caucasian ($91,668, a difference of 0.15%).
| Demographics | Rating | Rank | Householder Income Ages 25 - 44 years |
| Immigrants | Colombia | 21.3 /100 | #196 | Fair $92,204 |
| Spanish | 21.2 /100 | #197 | Fair $92,200 |
| Vietnamese | 20.2 /100 | #198 | Fair $92,089 |
| Kenyans | 16.8 /100 | #199 | Poor $91,684 |
| Whites/Caucasians | 16.7 /100 | #200 | Poor $91,668 |
| Japanese | 16.4 /100 | #201 | Poor $91,624 |
| Ecuadorians | 16.0 /100 | #202 | Poor $91,574 |
| Immigrants | Cambodia | 15.7 /100 | #203 | Poor $91,533 |
| Nepalese | 15.4 /100 | #204 | Poor $91,498 |
| Immigrants | Eastern Africa | 15.2 /100 | #205 | Poor $91,458 |
| Aleuts | 14.5 /100 | #206 | Poor $91,370 |
| Yugoslavians | 14.5 /100 | #207 | Poor $91,368 |
| Immigrants | Thailand | 14.3 /100 | #208 | Poor $91,337 |
| Immigrants | Uruguay | 13.2 /100 | #209 | Poor $91,171 |
| Immigrants | Kenya | 10.9 /100 | #210 | Poor $90,767 |
Demographics Similar to Uruguayans by Householder Income Ages 25 - 44 years
In terms of householder income ages 25 - 44 years, the demographic groups most similar to Uruguayans are Puget Sound Salish ($93,661, a difference of 0.030%), French ($93,665, a difference of 0.040%), French Canadian ($93,694, a difference of 0.070%), Guamanian/Chamorro ($93,569, a difference of 0.070%), and German ($93,531, a difference of 0.11%).
| Demographics | Rating | Rank | Householder Income Ages 25 - 44 years |
| English | 48.1 /100 | #175 | Average $94,429 |
| Immigrants | Immigrants | 48.0 /100 | #176 | Average $94,423 |
| Belgians | 45.8 /100 | #177 | Average $94,262 |
| Immigrants | South America | 42.8 /100 | #178 | Average $94,042 |
| French Canadians | 38.2 /100 | #179 | Fair $93,694 |
| French | 37.8 /100 | #180 | Fair $93,665 |
| Puget Sound Salish | 37.7 /100 | #181 | Fair $93,661 |
| Uruguayans | 37.3 /100 | #182 | Fair $93,631 |
| Guamanians/Chamorros | 36.5 /100 | #183 | Fair $93,569 |
| Germans | 36.0 /100 | #184 | Fair $93,531 |
| Immigrants | Eritrea | 35.2 /100 | #185 | Fair $93,466 |
| Sierra Leoneans | 34.8 /100 | #186 | Fair $93,435 |
| Spaniards | 34.0 /100 | #187 | Fair $93,366 |
| Immigrants | Sierra Leone | 30.9 /100 | #188 | Fair $93,115 |
| Dutch | 30.5 /100 | #189 | Fair $93,081 |