Immigrants from Asia vs Uruguayan Householder Income Ages 25 - 44 years
COMPARE
Immigrants from Asia
Uruguayan
Householder Income Ages 25 - 44 years
Householder Income Ages 25 - 44 years Comparison
Immigrants from Asia
Uruguayans
$110,787
HOUSEHOLDER INCOME AGES 25 - 44 YEARS
100.0/ 100
METRIC RATING
26th/ 347
METRIC RANK
$93,631
HOUSEHOLDER INCOME AGES 25 - 44 YEARS
37.3/ 100
METRIC RATING
182nd/ 347
METRIC RANK
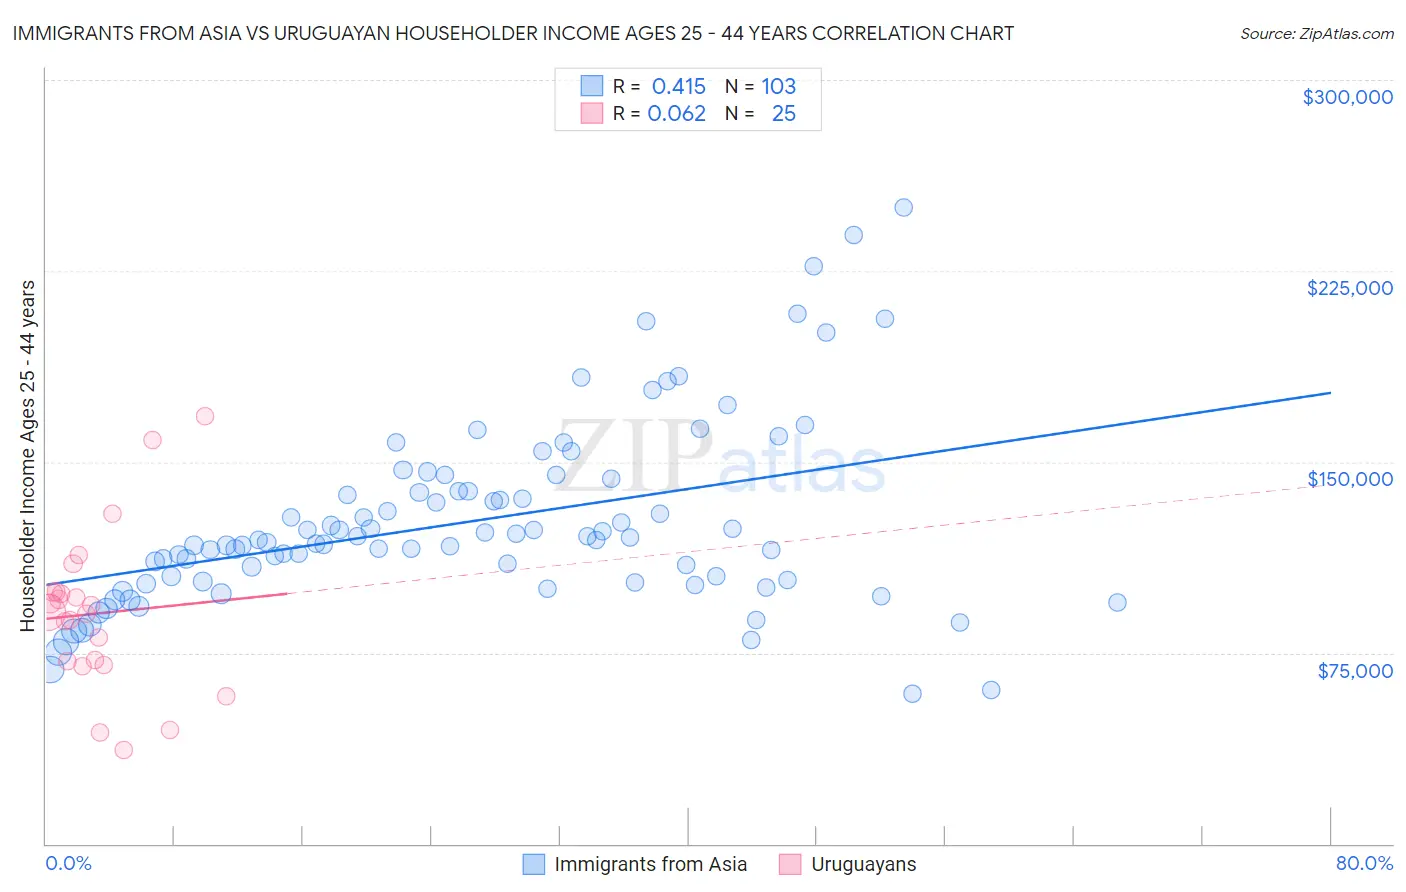
Immigrants from Asia vs Uruguayan Householder Income Ages 25 - 44 years Correlation Chart
The statistical analysis conducted on geographies consisting of 545,439,082 people shows a moderate positive correlation between the proportion of Immigrants from Asia and household income with householder between the ages 25 and 44 in the United States with a correlation coefficient (R) of 0.415 and weighted average of $110,787. Similarly, the statistical analysis conducted on geographies consisting of 144,694,507 people shows a slight positive correlation between the proportion of Uruguayans and household income with householder between the ages 25 and 44 in the United States with a correlation coefficient (R) of 0.062 and weighted average of $93,631, a difference of 18.3%.
Householder Income Ages 25 - 44 years Correlation Summary
| Measurement | Immigrants from Asia | Uruguayan |
| Minimum | $58,833 | $36,875 |
| Maximum | $250,001 | $167,820 |
| Range | $191,168 | $130,945 |
| Mean | $126,497 | $90,398 |
| Median | $119,126 | $91,039 |
| Interquartile 25% (IQ1) | $102,983 | $70,777 |
| Interquartile 75% (IQ3) | $138,372 | $98,813 |
| Interquartile Range (IQR) | $35,389 | $28,036 |
| Standard Deviation (Sample) | $36,204 | $31,106 |
| Standard Deviation (Population) | $36,028 | $30,478 |
Similar Demographics by Householder Income Ages 25 - 44 years
Demographics Similar to Immigrants from Asia by Householder Income Ages 25 - 44 years
In terms of householder income ages 25 - 44 years, the demographic groups most similar to Immigrants from Asia are Russian ($110,398, a difference of 0.35%), Immigrants from Denmark ($110,363, a difference of 0.38%), Turkish ($110,318, a difference of 0.42%), Immigrants from Greece ($110,103, a difference of 0.62%), and Maltese ($110,064, a difference of 0.66%).
| Demographics | Rating | Rank | Householder Income Ages 25 - 44 years |
| Burmese | 100.0 /100 | #19 | Exceptional $113,701 |
| Immigrants | Korea | 100.0 /100 | #20 | Exceptional $113,401 |
| Asians | 100.0 /100 | #21 | Exceptional $112,666 |
| Immigrants | Belgium | 100.0 /100 | #22 | Exceptional $112,575 |
| Immigrants | Japan | 100.0 /100 | #23 | Exceptional $112,228 |
| Immigrants | Sweden | 100.0 /100 | #24 | Exceptional $112,010 |
| Immigrants | Northern Europe | 100.0 /100 | #25 | Exceptional $111,676 |
| Immigrants | Asia | 100.0 /100 | #26 | Exceptional $110,787 |
| Russians | 100.0 /100 | #27 | Exceptional $110,398 |
| Immigrants | Denmark | 100.0 /100 | #28 | Exceptional $110,363 |
| Turks | 100.0 /100 | #29 | Exceptional $110,318 |
| Immigrants | Greece | 100.0 /100 | #30 | Exceptional $110,103 |
| Maltese | 100.0 /100 | #31 | Exceptional $110,064 |
| Immigrants | Sri Lanka | 100.0 /100 | #32 | Exceptional $109,741 |
| Bhutanese | 100.0 /100 | #33 | Exceptional $109,520 |
Demographics Similar to Uruguayans by Householder Income Ages 25 - 44 years
In terms of householder income ages 25 - 44 years, the demographic groups most similar to Uruguayans are Puget Sound Salish ($93,661, a difference of 0.030%), French ($93,665, a difference of 0.040%), French Canadian ($93,694, a difference of 0.070%), Guamanian/Chamorro ($93,569, a difference of 0.070%), and German ($93,531, a difference of 0.11%).
| Demographics | Rating | Rank | Householder Income Ages 25 - 44 years |
| English | 48.1 /100 | #175 | Average $94,429 |
| Immigrants | Immigrants | 48.0 /100 | #176 | Average $94,423 |
| Belgians | 45.8 /100 | #177 | Average $94,262 |
| Immigrants | South America | 42.8 /100 | #178 | Average $94,042 |
| French Canadians | 38.2 /100 | #179 | Fair $93,694 |
| French | 37.8 /100 | #180 | Fair $93,665 |
| Puget Sound Salish | 37.7 /100 | #181 | Fair $93,661 |
| Uruguayans | 37.3 /100 | #182 | Fair $93,631 |
| Guamanians/Chamorros | 36.5 /100 | #183 | Fair $93,569 |
| Germans | 36.0 /100 | #184 | Fair $93,531 |
| Immigrants | Eritrea | 35.2 /100 | #185 | Fair $93,466 |
| Sierra Leoneans | 34.8 /100 | #186 | Fair $93,435 |
| Spaniards | 34.0 /100 | #187 | Fair $93,366 |
| Immigrants | Sierra Leone | 30.9 /100 | #188 | Fair $93,115 |
| Dutch | 30.5 /100 | #189 | Fair $93,081 |