Yuman vs Black/African American Householder Income Ages 25 - 44 years
COMPARE
Yuman
Black/African American
Householder Income Ages 25 - 44 years
Householder Income Ages 25 - 44 years Comparison
Yuman
Blacks/African Americans
$72,956
HOUSEHOLDER INCOME AGES 25 - 44 YEARS
0.0/ 100
METRIC RATING
339th/ 347
METRIC RANK
$73,370
HOUSEHOLDER INCOME AGES 25 - 44 YEARS
0.0/ 100
METRIC RATING
337th/ 347
METRIC RANK
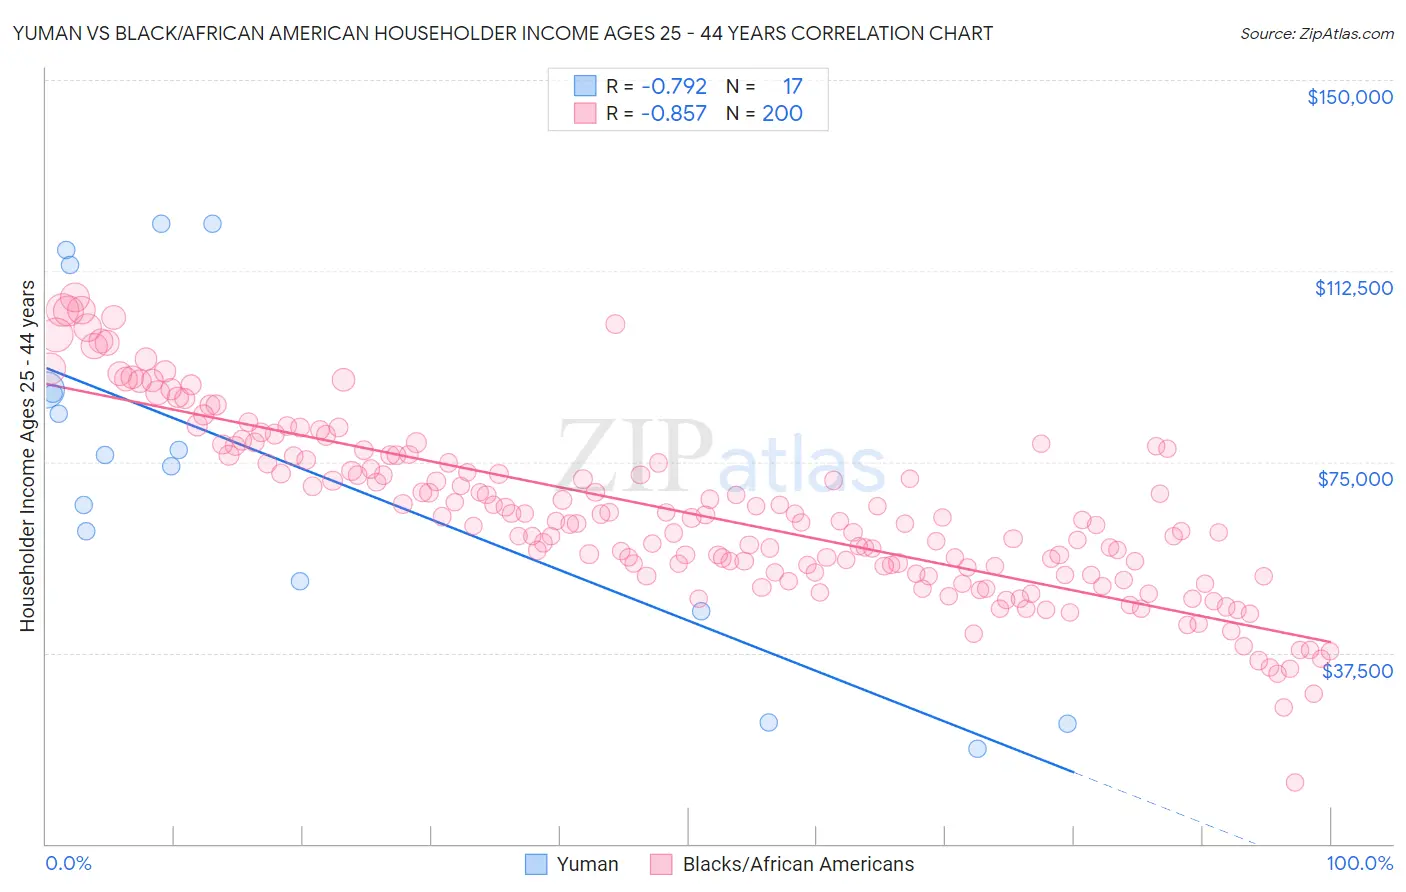
Yuman vs Black/African American Householder Income Ages 25 - 44 years Correlation Chart
The statistical analysis conducted on geographies consisting of 40,597,364 people shows a strong negative correlation between the proportion of Yuman and household income with householder between the ages 25 and 44 in the United States with a correlation coefficient (R) of -0.792 and weighted average of $72,956. Similarly, the statistical analysis conducted on geographies consisting of 560,674,363 people shows a very strong negative correlation between the proportion of Blacks/African Americans and household income with householder between the ages 25 and 44 in the United States with a correlation coefficient (R) of -0.857 and weighted average of $73,370, a difference of 0.57%.
Householder Income Ages 25 - 44 years Correlation Summary
| Measurement | Yuman | Black/African American |
| Minimum | $18,542 | $12,048 |
| Maximum | $121,667 | $107,395 |
| Range | $103,125 | $95,347 |
| Mean | $73,782 | $64,936 |
| Median | $76,250 | $63,200 |
| Interquartile 25% (IQ1) | $48,591 | $53,277 |
| Interquartile 75% (IQ3) | $101,410 | $76,198 |
| Interquartile Range (IQR) | $52,819 | $22,921 |
| Standard Deviation (Sample) | $33,681 | $17,118 |
| Standard Deviation (Population) | $32,676 | $17,075 |
Demographics Similar to Yuman and Blacks/African Americans by Householder Income Ages 25 - 44 years
In terms of householder income ages 25 - 44 years, the demographic groups most similar to Yuman are Immigrants from Yemen ($73,043, a difference of 0.12%), Yup'ik ($73,688, a difference of 1.0%), Immigrants from Congo ($72,178, a difference of 1.1%), Arapaho ($71,697, a difference of 1.8%), and Crow ($71,337, a difference of 2.3%). Similarly, the demographic groups most similar to Blacks/African Americans are Yup'ik ($73,688, a difference of 0.43%), Immigrants from Yemen ($73,043, a difference of 0.45%), Immigrants from Congo ($72,178, a difference of 1.7%), Kiowa ($74,776, a difference of 1.9%), and Creek ($74,847, a difference of 2.0%).
| Demographics | Rating | Rank | Householder Income Ages 25 - 44 years |
| Immigrants | Cuba | 0.0 /100 | #328 | Tragic $76,701 |
| Seminole | 0.0 /100 | #329 | Tragic $76,584 |
| Yakama | 0.0 /100 | #330 | Tragic $76,226 |
| Natives/Alaskans | 0.0 /100 | #331 | Tragic $75,647 |
| Bahamians | 0.0 /100 | #332 | Tragic $75,395 |
| Hopi | 0.0 /100 | #333 | Tragic $75,002 |
| Creek | 0.0 /100 | #334 | Tragic $74,847 |
| Kiowa | 0.0 /100 | #335 | Tragic $74,776 |
| Yup'ik | 0.0 /100 | #336 | Tragic $73,688 |
| Blacks/African Americans | 0.0 /100 | #337 | Tragic $73,370 |
| Immigrants | Yemen | 0.0 /100 | #338 | Tragic $73,043 |
| Yuman | 0.0 /100 | #339 | Tragic $72,956 |
| Immigrants | Congo | 0.0 /100 | #340 | Tragic $72,178 |
| Arapaho | 0.0 /100 | #341 | Tragic $71,697 |
| Crow | 0.0 /100 | #342 | Tragic $71,337 |
| Tohono O'odham | 0.0 /100 | #343 | Tragic $69,068 |
| Pueblo | 0.0 /100 | #344 | Tragic $68,910 |
| Navajo | 0.0 /100 | #345 | Tragic $66,529 |
| Puerto Ricans | 0.0 /100 | #346 | Tragic $65,996 |
| Lumbee | 0.0 /100 | #347 | Tragic $60,305 |