Hungarian vs Kiowa Householder Income Ages 45 - 64 years
COMPARE
Hungarian
Kiowa
Householder Income Ages 45 - 64 years
Householder Income Ages 45 - 64 years Comparison
Hungarians
Kiowa
$103,913
HOUSEHOLDER INCOME AGES 45 - 64 YEARS
85.8/ 100
METRIC RATING
137th/ 347
METRIC RANK
$74,815
HOUSEHOLDER INCOME AGES 45 - 64 YEARS
0.0/ 100
METRIC RATING
339th/ 347
METRIC RANK
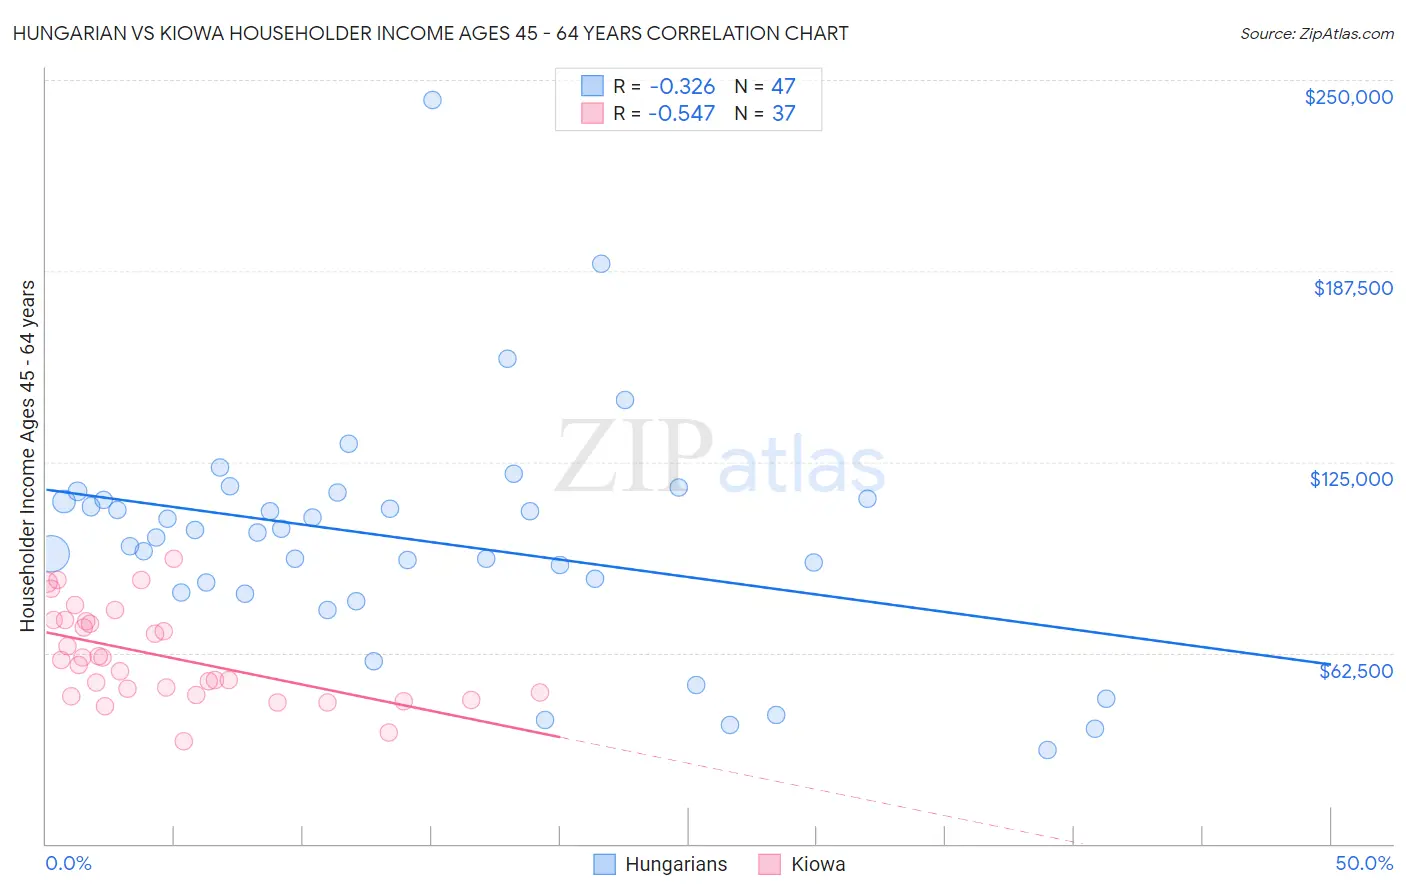
Hungarian vs Kiowa Householder Income Ages 45 - 64 years Correlation Chart
The statistical analysis conducted on geographies consisting of 484,921,050 people shows a mild negative correlation between the proportion of Hungarians and household income with householder between the ages 45 and 64 in the United States with a correlation coefficient (R) of -0.326 and weighted average of $103,913. Similarly, the statistical analysis conducted on geographies consisting of 56,088,586 people shows a substantial negative correlation between the proportion of Kiowa and household income with householder between the ages 45 and 64 in the United States with a correlation coefficient (R) of -0.547 and weighted average of $74,815, a difference of 38.9%.
Householder Income Ages 45 - 64 years Correlation Summary
| Measurement | Hungarian | Kiowa |
| Minimum | $30,798 | $33,438 |
| Maximum | $243,392 | $93,403 |
| Range | $212,594 | $59,965 |
| Mean | $99,450 | $61,508 |
| Median | $101,881 | $60,248 |
| Interquartile 25% (IQ1) | $82,262 | $49,045 |
| Interquartile 75% (IQ3) | $112,938 | $72,863 |
| Interquartile Range (IQR) | $30,676 | $23,818 |
| Standard Deviation (Sample) | $38,021 | $15,003 |
| Standard Deviation (Population) | $37,614 | $14,798 |
Similar Demographics by Householder Income Ages 45 - 64 years
Demographics Similar to Hungarians by Householder Income Ages 45 - 64 years
In terms of householder income ages 45 - 64 years, the demographic groups most similar to Hungarians are Ethiopian ($103,736, a difference of 0.17%), Immigrants from Oceania ($103,705, a difference of 0.20%), Norwegian ($103,682, a difference of 0.22%), Taiwanese ($104,180, a difference of 0.26%), and Immigrants from Uganda ($103,584, a difference of 0.32%).
| Demographics | Rating | Rank | Householder Income Ages 45 - 64 years |
| Immigrants | Zimbabwe | 91.2 /100 | #130 | Exceptional $104,992 |
| Immigrants | Syria | 90.7 /100 | #131 | Exceptional $104,858 |
| Lebanese | 90.1 /100 | #132 | Exceptional $104,734 |
| Arabs | 89.3 /100 | #133 | Excellent $104,566 |
| Canadians | 89.3 /100 | #134 | Excellent $104,560 |
| Brazilians | 88.6 /100 | #135 | Excellent $104,408 |
| Taiwanese | 87.4 /100 | #136 | Excellent $104,180 |
| Hungarians | 85.8 /100 | #137 | Excellent $103,913 |
| Ethiopians | 84.7 /100 | #138 | Excellent $103,736 |
| Immigrants | Oceania | 84.5 /100 | #139 | Excellent $103,705 |
| Norwegians | 84.3 /100 | #140 | Excellent $103,682 |
| Immigrants | Uganda | 83.7 /100 | #141 | Excellent $103,584 |
| Luxembourgers | 83.3 /100 | #142 | Excellent $103,536 |
| Serbians | 83.2 /100 | #143 | Excellent $103,522 |
| Czechs | 83.1 /100 | #144 | Excellent $103,507 |
Demographics Similar to Kiowa by Householder Income Ages 45 - 64 years
In terms of householder income ages 45 - 64 years, the demographic groups most similar to Kiowa are Immigrants from Yemen ($74,575, a difference of 0.32%), Crow ($74,257, a difference of 0.75%), Hopi ($75,562, a difference of 1.0%), Pueblo ($75,601, a difference of 1.1%), and Tohono O'odham ($73,774, a difference of 1.4%).
| Demographics | Rating | Rank | Householder Income Ages 45 - 64 years |
| Blacks/African Americans | 0.0 /100 | #332 | Tragic $78,556 |
| Immigrants | Congo | 0.0 /100 | #333 | Tragic $77,850 |
| Menominee | 0.0 /100 | #334 | Tragic $76,903 |
| Cheyenne | 0.0 /100 | #335 | Tragic $76,362 |
| Arapaho | 0.0 /100 | #336 | Tragic $75,945 |
| Pueblo | 0.0 /100 | #337 | Tragic $75,601 |
| Hopi | 0.0 /100 | #338 | Tragic $75,562 |
| Kiowa | 0.0 /100 | #339 | Tragic $74,815 |
| Immigrants | Yemen | 0.0 /100 | #340 | Tragic $74,575 |
| Crow | 0.0 /100 | #341 | Tragic $74,257 |
| Tohono O'odham | 0.0 /100 | #342 | Tragic $73,774 |
| Pima | 0.0 /100 | #343 | Tragic $73,365 |
| Houma | 0.0 /100 | #344 | Tragic $72,093 |
| Navajo | 0.0 /100 | #345 | Tragic $69,759 |
| Puerto Ricans | 0.0 /100 | #346 | Tragic $69,234 |