Immigrants from Venezuela vs Immigrants from Western Europe Median Household Income
COMPARE
Immigrants from Venezuela
Immigrants from Western Europe
Median Household Income
Median Household Income Comparison
Immigrants from Venezuela
Immigrants from Western Europe
$81,506
MEDIAN HOUSEHOLD INCOME
9.0/ 100
METRIC RATING
220th/ 347
METRIC RANK
$91,936
MEDIAN HOUSEHOLD INCOME
98.8/ 100
METRIC RATING
92nd/ 347
METRIC RANK
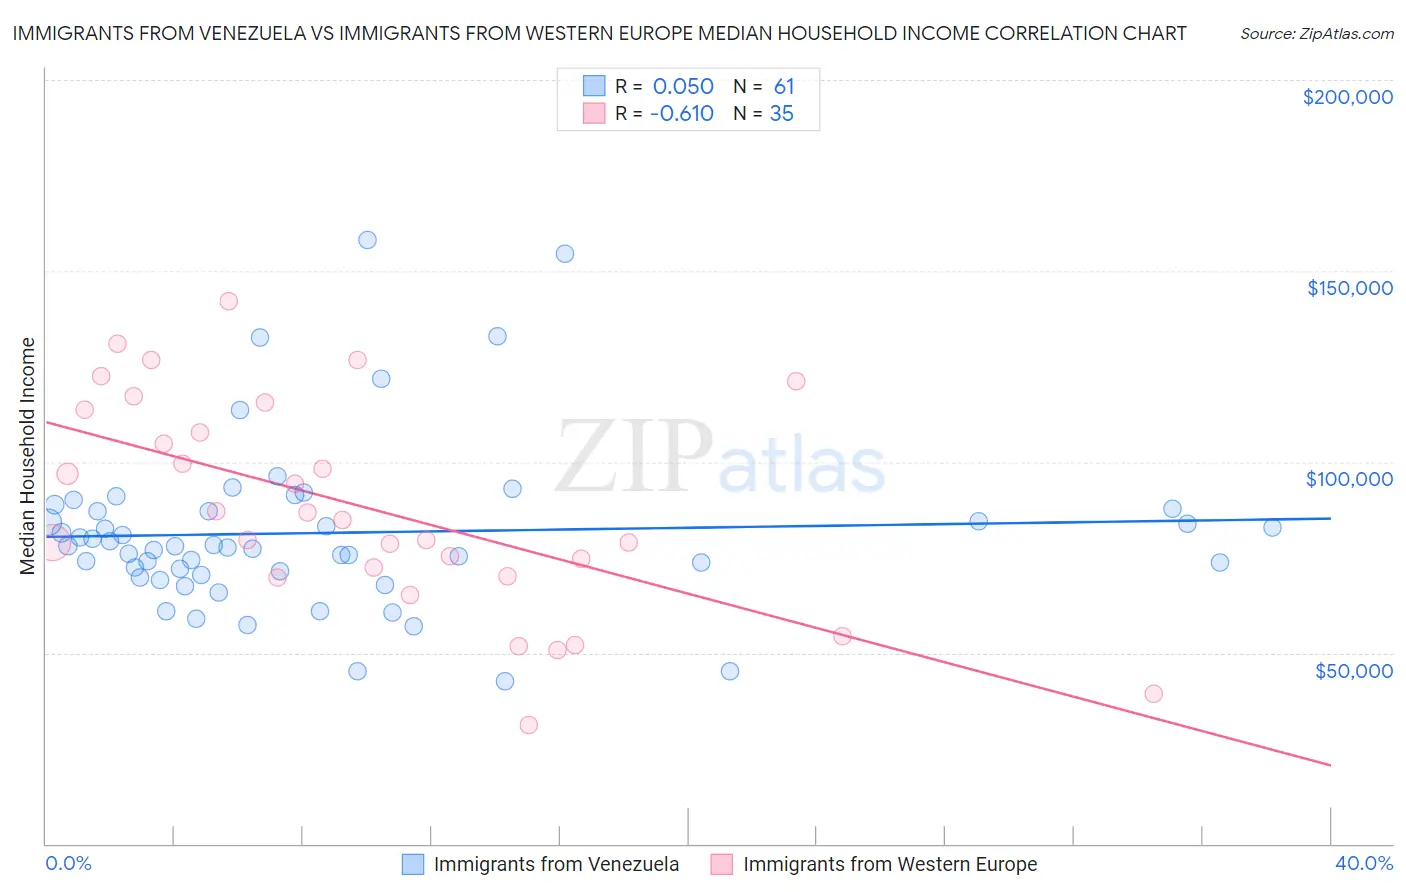
Immigrants from Venezuela vs Immigrants from Western Europe Median Household Income Correlation Chart
The statistical analysis conducted on geographies consisting of 287,748,058 people shows a slight positive correlation between the proportion of Immigrants from Venezuela and median household income in the United States with a correlation coefficient (R) of 0.050 and weighted average of $81,506. Similarly, the statistical analysis conducted on geographies consisting of 493,674,241 people shows a significant negative correlation between the proportion of Immigrants from Western Europe and median household income in the United States with a correlation coefficient (R) of -0.610 and weighted average of $91,936, a difference of 12.8%.
Median Household Income Correlation Summary
| Measurement | Immigrants from Venezuela | Immigrants from Western Europe |
| Minimum | $42,664 | $31,182 |
| Maximum | $158,184 | $142,061 |
| Range | $115,520 | $110,879 |
| Mean | $81,402 | $87,927 |
| Median | $77,762 | $84,863 |
| Interquartile 25% (IQ1) | $70,867 | $69,977 |
| Interquartile 75% (IQ3) | $87,517 | $113,640 |
| Interquartile Range (IQR) | $16,650 | $43,663 |
| Standard Deviation (Sample) | $22,039 | $27,795 |
| Standard Deviation (Population) | $21,858 | $27,395 |
Similar Demographics by Median Household Income
Demographics Similar to Immigrants from Venezuela by Median Household Income
In terms of median household income, the demographic groups most similar to Immigrants from Venezuela are Immigrants from Ghana ($81,489, a difference of 0.020%), Nigerian ($81,725, a difference of 0.27%), Immigrants from Nigeria ($81,236, a difference of 0.33%), Immigrants from El Salvador ($81,213, a difference of 0.36%), and Malaysian ($81,064, a difference of 0.54%).
| Demographics | Rating | Rank | Median Household Income |
| Nepalese | 15.1 /100 | #213 | Poor $82,410 |
| Panamanians | 14.0 /100 | #214 | Poor $82,272 |
| Vietnamese | 13.8 /100 | #215 | Poor $82,248 |
| Yugoslavians | 13.3 /100 | #216 | Poor $82,186 |
| Ecuadorians | 12.5 /100 | #217 | Poor $82,070 |
| Whites/Caucasians | 12.2 /100 | #218 | Poor $82,029 |
| Nigerians | 10.3 /100 | #219 | Poor $81,725 |
| Immigrants | Venezuela | 9.0 /100 | #220 | Tragic $81,506 |
| Immigrants | Ghana | 9.0 /100 | #221 | Tragic $81,489 |
| Immigrants | Nigeria | 7.7 /100 | #222 | Tragic $81,236 |
| Immigrants | El Salvador | 7.6 /100 | #223 | Tragic $81,213 |
| Malaysians | 7.0 /100 | #224 | Tragic $81,064 |
| Scotch-Irish | 6.6 /100 | #225 | Tragic $80,972 |
| Immigrants | Panama | 6.2 /100 | #226 | Tragic $80,873 |
| Guyanese | 5.7 /100 | #227 | Tragic $80,734 |
Demographics Similar to Immigrants from Western Europe by Median Household Income
In terms of median household income, the demographic groups most similar to Immigrants from Western Europe are Immigrants from Lebanon ($91,887, a difference of 0.050%), Romanian ($91,994, a difference of 0.060%), Assyrian/Chaldean/Syriac ($91,991, a difference of 0.060%), Immigrants from Vietnam ($91,987, a difference of 0.060%), and Immigrants from North America ($91,860, a difference of 0.080%).
| Demographics | Rating | Rank | Median Household Income |
| Immigrants | Croatia | 99.0 /100 | #85 | Exceptional $92,225 |
| Immigrants | England | 98.9 /100 | #86 | Exceptional $92,098 |
| Immigrants | Hungary | 98.9 /100 | #87 | Exceptional $92,094 |
| Immigrants | Canada | 98.8 /100 | #88 | Exceptional $92,029 |
| Romanians | 98.8 /100 | #89 | Exceptional $91,994 |
| Assyrians/Chaldeans/Syriacs | 98.8 /100 | #90 | Exceptional $91,991 |
| Immigrants | Vietnam | 98.8 /100 | #91 | Exceptional $91,987 |
| Immigrants | Western Europe | 98.8 /100 | #92 | Exceptional $91,936 |
| Immigrants | Lebanon | 98.7 /100 | #93 | Exceptional $91,887 |
| Immigrants | North America | 98.7 /100 | #94 | Exceptional $91,860 |
| Armenians | 98.7 /100 | #95 | Exceptional $91,807 |
| Jordanians | 98.7 /100 | #96 | Exceptional $91,794 |
| Immigrants | Serbia | 98.6 /100 | #97 | Exceptional $91,730 |
| Immigrants | Southern Europe | 98.5 /100 | #98 | Exceptional $91,605 |
| Immigrants | South Eastern Asia | 98.4 /100 | #99 | Exceptional $91,541 |