Yugoslavian vs Paraguayan Median Female Earnings
COMPARE
Yugoslavian
Paraguayan
Median Female Earnings
Median Female Earnings Comparison
Yugoslavians
Paraguayans
$38,573
MEDIAN FEMALE EARNINGS
8.8/ 100
METRIC RATING
220th/ 347
METRIC RANK
$43,173
MEDIAN FEMALE EARNINGS
99.9/ 100
METRIC RATING
58th/ 347
METRIC RANK
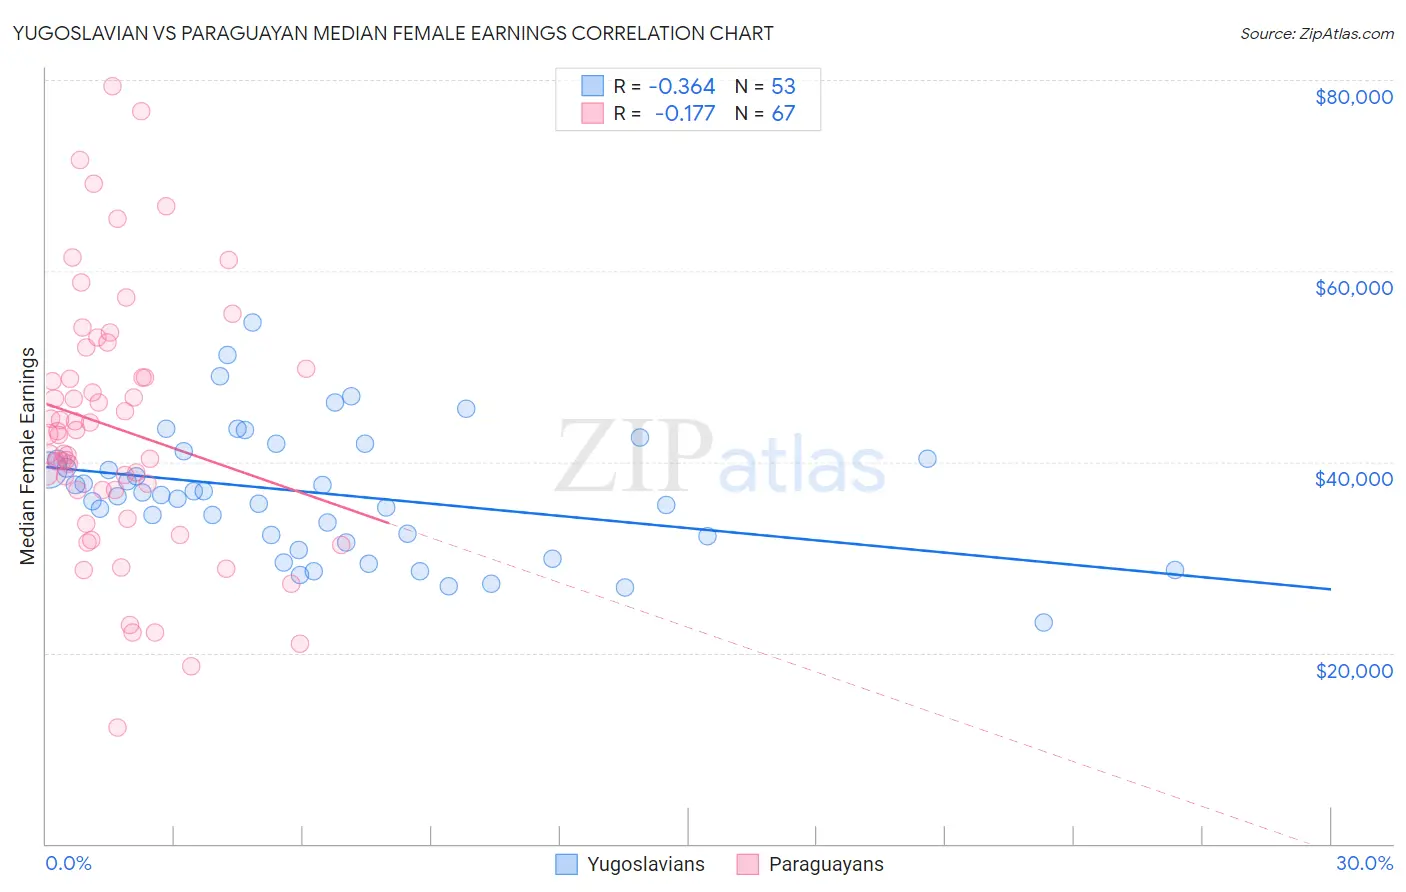
Yugoslavian vs Paraguayan Median Female Earnings Correlation Chart
The statistical analysis conducted on geographies consisting of 285,638,776 people shows a mild negative correlation between the proportion of Yugoslavians and median female earnings in the United States with a correlation coefficient (R) of -0.364 and weighted average of $38,573. Similarly, the statistical analysis conducted on geographies consisting of 95,111,705 people shows a poor negative correlation between the proportion of Paraguayans and median female earnings in the United States with a correlation coefficient (R) of -0.177 and weighted average of $43,173, a difference of 11.9%.
Median Female Earnings Correlation Summary
| Measurement | Yugoslavian | Paraguayan |
| Minimum | $23,125 | $12,152 |
| Maximum | $54,556 | $79,410 |
| Range | $31,431 | $67,258 |
| Mean | $36,696 | $43,505 |
| Median | $36,579 | $42,896 |
| Interquartile 25% (IQ1) | $31,882 | $37,010 |
| Interquartile 75% (IQ3) | $40,715 | $49,789 |
| Interquartile Range (IQR) | $8,834 | $12,779 |
| Standard Deviation (Sample) | $6,632 | $13,576 |
| Standard Deviation (Population) | $6,570 | $13,475 |
Similar Demographics by Median Female Earnings
Demographics Similar to Yugoslavians by Median Female Earnings
In terms of median female earnings, the demographic groups most similar to Yugoslavians are Immigrants from the Azores ($38,573, a difference of 0.0%), Nepalese ($38,603, a difference of 0.080%), Cape Verdean ($38,614, a difference of 0.11%), Japanese ($38,528, a difference of 0.12%), and Immigrants from Jamaica ($38,625, a difference of 0.14%).
| Demographics | Rating | Rank | Median Female Earnings |
| Jamaicans | 10.5 /100 | #213 | Poor $38,670 |
| Iraqis | 10.5 /100 | #214 | Poor $38,666 |
| Spaniards | 10.3 /100 | #215 | Poor $38,656 |
| Immigrants | Ecuador | 10.1 /100 | #216 | Poor $38,644 |
| Immigrants | Jamaica | 9.7 /100 | #217 | Tragic $38,625 |
| Cape Verdeans | 9.5 /100 | #218 | Tragic $38,614 |
| Nepalese | 9.3 /100 | #219 | Tragic $38,603 |
| Yugoslavians | 8.8 /100 | #220 | Tragic $38,573 |
| Immigrants | Azores | 8.8 /100 | #221 | Tragic $38,573 |
| Japanese | 8.1 /100 | #222 | Tragic $38,528 |
| Immigrants | Sudan | 7.8 /100 | #223 | Tragic $38,511 |
| Native Hawaiians | 7.1 /100 | #224 | Tragic $38,461 |
| French | 7.0 /100 | #225 | Tragic $38,457 |
| French Canadians | 6.8 /100 | #226 | Tragic $38,436 |
| Scottish | 6.3 /100 | #227 | Tragic $38,397 |
Demographics Similar to Paraguayans by Median Female Earnings
In terms of median female earnings, the demographic groups most similar to Paraguayans are Ethiopian ($43,243, a difference of 0.16%), Estonian ($43,106, a difference of 0.16%), Immigrants from Latvia ($43,099, a difference of 0.17%), Immigrants from Croatia ($43,258, a difference of 0.20%), and Immigrants from Bulgaria ($43,085, a difference of 0.20%).
| Demographics | Rating | Rank | Median Female Earnings |
| Maltese | 100.0 /100 | #51 | Exceptional $43,357 |
| Immigrants | Lithuania | 99.9 /100 | #52 | Exceptional $43,317 |
| Immigrants | Eastern Europe | 99.9 /100 | #53 | Exceptional $43,309 |
| Australians | 99.9 /100 | #54 | Exceptional $43,308 |
| Egyptians | 99.9 /100 | #55 | Exceptional $43,305 |
| Immigrants | Croatia | 99.9 /100 | #56 | Exceptional $43,258 |
| Ethiopians | 99.9 /100 | #57 | Exceptional $43,243 |
| Paraguayans | 99.9 /100 | #58 | Exceptional $43,173 |
| Estonians | 99.9 /100 | #59 | Exceptional $43,106 |
| Immigrants | Latvia | 99.9 /100 | #60 | Exceptional $43,099 |
| Immigrants | Bulgaria | 99.9 /100 | #61 | Exceptional $43,085 |
| Afghans | 99.9 /100 | #62 | Exceptional $43,077 |
| Immigrants | Ukraine | 99.9 /100 | #63 | Exceptional $43,069 |
| Immigrants | Pakistan | 99.9 /100 | #64 | Exceptional $43,052 |
| Sierra Leoneans | 99.9 /100 | #65 | Exceptional $42,868 |