German Russian vs Paraguayan Median Female Earnings
COMPARE
German Russian
Paraguayan
Median Female Earnings
Median Female Earnings Comparison
German Russians
Paraguayans
$37,105
MEDIAN FEMALE EARNINGS
0.5/ 100
METRIC RATING
263rd/ 347
METRIC RANK
$43,173
MEDIAN FEMALE EARNINGS
99.9/ 100
METRIC RATING
58th/ 347
METRIC RANK
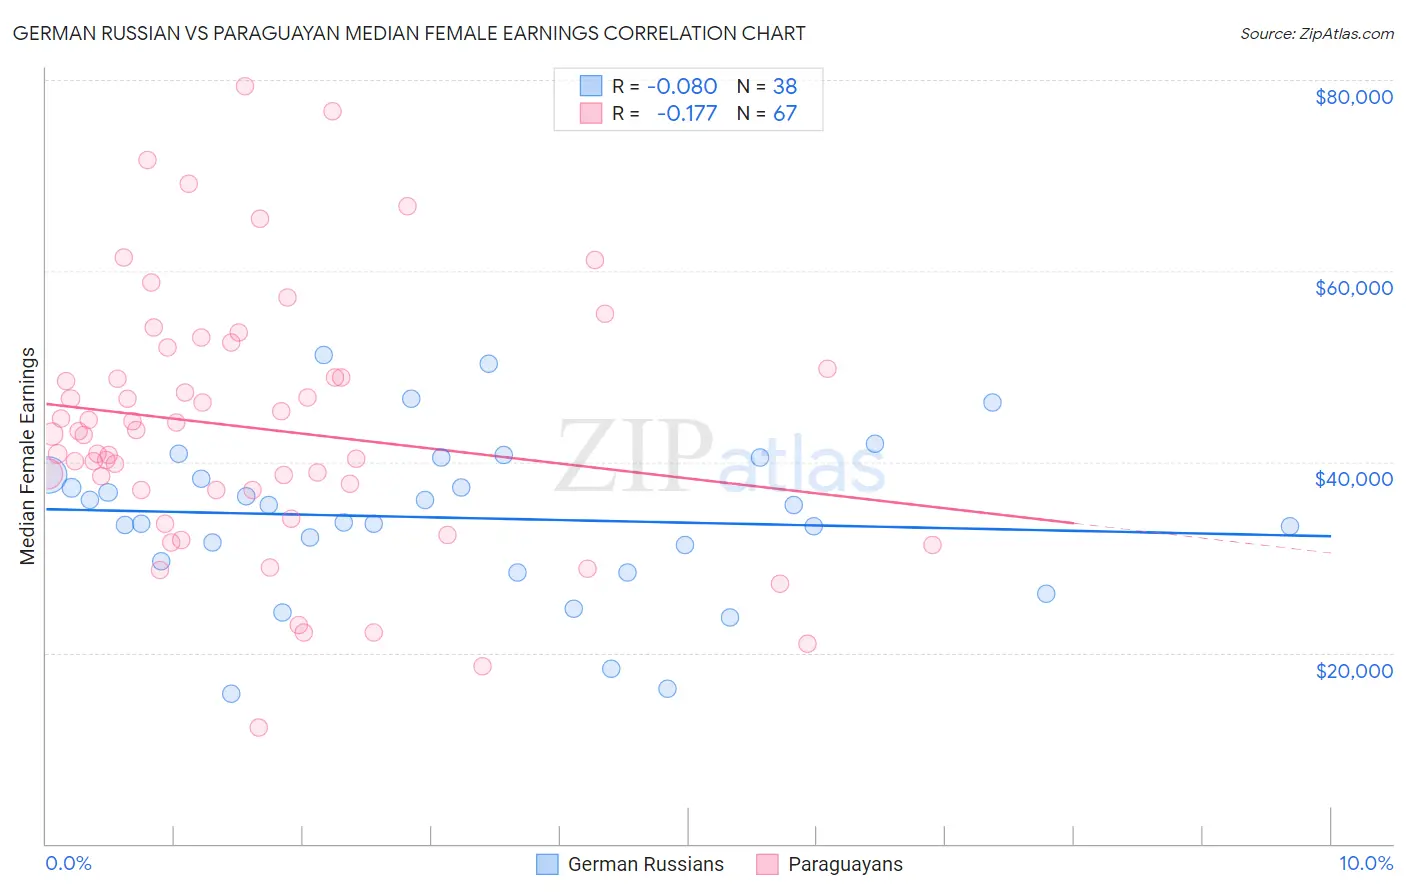
German Russian vs Paraguayan Median Female Earnings Correlation Chart
The statistical analysis conducted on geographies consisting of 96,453,013 people shows a slight negative correlation between the proportion of German Russians and median female earnings in the United States with a correlation coefficient (R) of -0.080 and weighted average of $37,105. Similarly, the statistical analysis conducted on geographies consisting of 95,111,705 people shows a poor negative correlation between the proportion of Paraguayans and median female earnings in the United States with a correlation coefficient (R) of -0.177 and weighted average of $43,173, a difference of 16.4%.
Median Female Earnings Correlation Summary
| Measurement | German Russian | Paraguayan |
| Minimum | $15,652 | $12,152 |
| Maximum | $51,256 | $79,410 |
| Range | $35,604 | $67,258 |
| Mean | $34,138 | $43,505 |
| Median | $34,536 | $42,896 |
| Interquartile 25% (IQ1) | $29,635 | $37,010 |
| Interquartile 75% (IQ3) | $38,614 | $49,789 |
| Interquartile Range (IQR) | $8,979 | $12,779 |
| Standard Deviation (Sample) | $8,300 | $13,576 |
| Standard Deviation (Population) | $8,190 | $13,475 |
Similar Demographics by Median Female Earnings
Demographics Similar to German Russians by Median Female Earnings
In terms of median female earnings, the demographic groups most similar to German Russians are Salvadoran ($37,083, a difference of 0.060%), Immigrants from Belize ($37,056, a difference of 0.13%), Dominican ($37,046, a difference of 0.16%), Nonimmigrants ($37,024, a difference of 0.22%), and Cree ($37,018, a difference of 0.24%).
| Demographics | Rating | Rank | Median Female Earnings |
| Samoans | 1.0 /100 | #256 | Tragic $37,498 |
| Hawaiians | 1.0 /100 | #257 | Tragic $37,497 |
| Belizeans | 0.9 /100 | #258 | Tragic $37,429 |
| Scotch-Irish | 0.8 /100 | #259 | Tragic $37,383 |
| Dutch | 0.7 /100 | #260 | Tragic $37,339 |
| Malaysians | 0.7 /100 | #261 | Tragic $37,298 |
| Venezuelans | 0.7 /100 | #262 | Tragic $37,282 |
| German Russians | 0.5 /100 | #263 | Tragic $37,105 |
| Salvadorans | 0.4 /100 | #264 | Tragic $37,083 |
| Immigrants | Belize | 0.4 /100 | #265 | Tragic $37,056 |
| Dominicans | 0.4 /100 | #266 | Tragic $37,046 |
| Immigrants | Nonimmigrants | 0.4 /100 | #267 | Tragic $37,024 |
| Cree | 0.4 /100 | #268 | Tragic $37,018 |
| Immigrants | Venezuela | 0.4 /100 | #269 | Tragic $37,003 |
| French American Indians | 0.3 /100 | #270 | Tragic $36,920 |
Demographics Similar to Paraguayans by Median Female Earnings
In terms of median female earnings, the demographic groups most similar to Paraguayans are Ethiopian ($43,243, a difference of 0.16%), Estonian ($43,106, a difference of 0.16%), Immigrants from Latvia ($43,099, a difference of 0.17%), Immigrants from Croatia ($43,258, a difference of 0.20%), and Immigrants from Bulgaria ($43,085, a difference of 0.20%).
| Demographics | Rating | Rank | Median Female Earnings |
| Maltese | 100.0 /100 | #51 | Exceptional $43,357 |
| Immigrants | Lithuania | 99.9 /100 | #52 | Exceptional $43,317 |
| Immigrants | Eastern Europe | 99.9 /100 | #53 | Exceptional $43,309 |
| Australians | 99.9 /100 | #54 | Exceptional $43,308 |
| Egyptians | 99.9 /100 | #55 | Exceptional $43,305 |
| Immigrants | Croatia | 99.9 /100 | #56 | Exceptional $43,258 |
| Ethiopians | 99.9 /100 | #57 | Exceptional $43,243 |
| Paraguayans | 99.9 /100 | #58 | Exceptional $43,173 |
| Estonians | 99.9 /100 | #59 | Exceptional $43,106 |
| Immigrants | Latvia | 99.9 /100 | #60 | Exceptional $43,099 |
| Immigrants | Bulgaria | 99.9 /100 | #61 | Exceptional $43,085 |
| Afghans | 99.9 /100 | #62 | Exceptional $43,077 |
| Immigrants | Ukraine | 99.9 /100 | #63 | Exceptional $43,069 |
| Immigrants | Pakistan | 99.9 /100 | #64 | Exceptional $43,052 |
| Sierra Leoneans | 99.9 /100 | #65 | Exceptional $42,868 |