Mexican vs Paraguayan Median Female Earnings
COMPARE
Mexican
Paraguayan
Median Female Earnings
Median Female Earnings Comparison
Mexicans
Paraguayans
$33,664
MEDIAN FEMALE EARNINGS
0.0/ 100
METRIC RATING
333rd/ 347
METRIC RANK
$43,173
MEDIAN FEMALE EARNINGS
99.9/ 100
METRIC RATING
58th/ 347
METRIC RANK
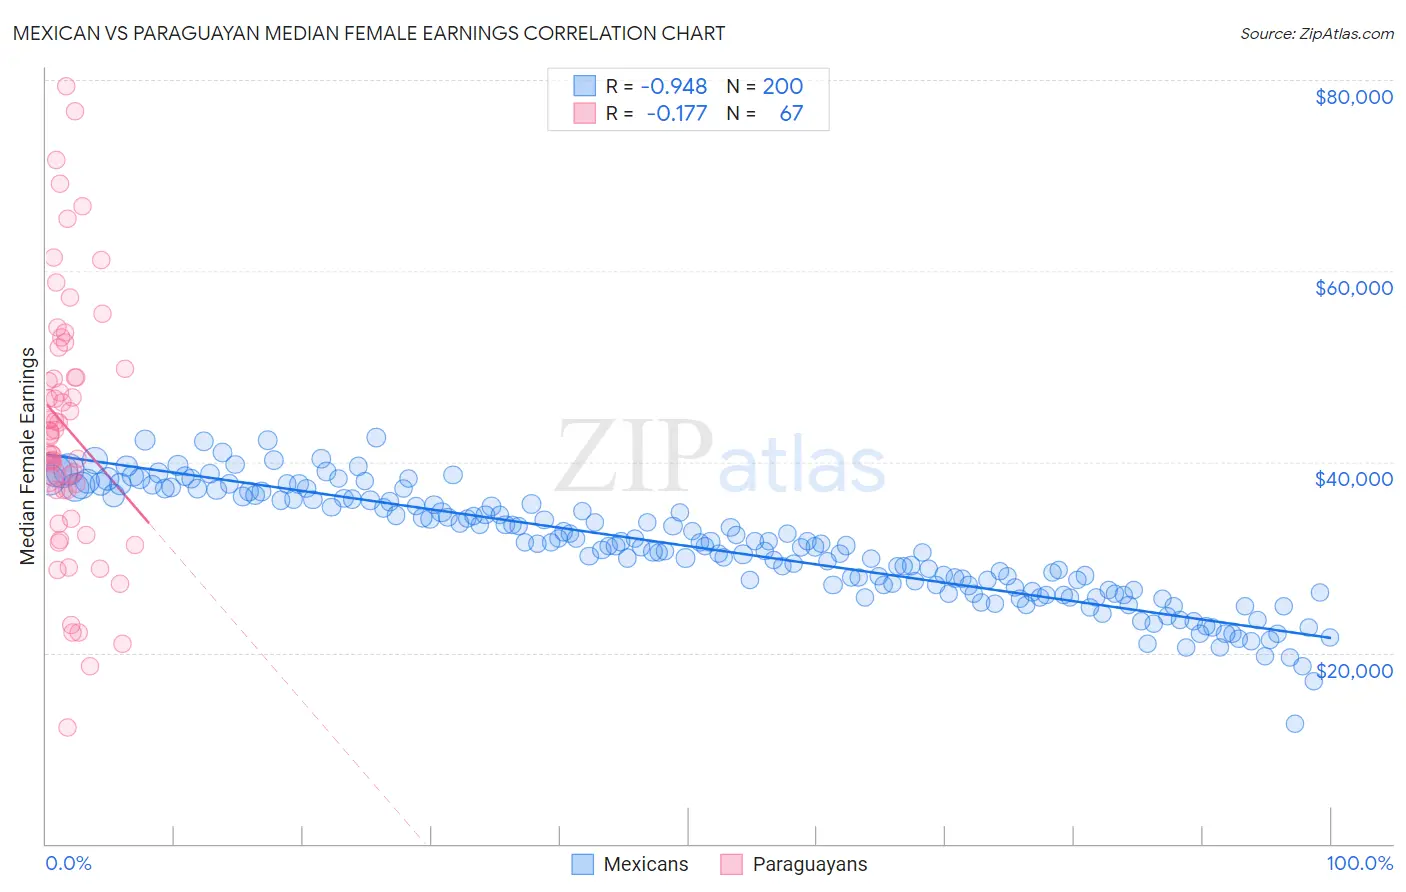
Mexican vs Paraguayan Median Female Earnings Correlation Chart
The statistical analysis conducted on geographies consisting of 563,682,270 people shows a near-perfect negative correlation between the proportion of Mexicans and median female earnings in the United States with a correlation coefficient (R) of -0.948 and weighted average of $33,664. Similarly, the statistical analysis conducted on geographies consisting of 95,111,705 people shows a poor negative correlation between the proportion of Paraguayans and median female earnings in the United States with a correlation coefficient (R) of -0.177 and weighted average of $43,173, a difference of 28.2%.
Median Female Earnings Correlation Summary
| Measurement | Mexican | Paraguayan |
| Minimum | $12,526 | $12,152 |
| Maximum | $42,584 | $79,410 |
| Range | $30,058 | $67,258 |
| Mean | $31,173 | $43,505 |
| Median | $31,351 | $42,896 |
| Interquartile 25% (IQ1) | $26,695 | $37,010 |
| Interquartile 75% (IQ3) | $36,091 | $49,789 |
| Interquartile Range (IQR) | $9,396 | $12,779 |
| Standard Deviation (Sample) | $5,874 | $13,576 |
| Standard Deviation (Population) | $5,859 | $13,475 |
Similar Demographics by Median Female Earnings
Demographics Similar to Mexicans by Median Female Earnings
In terms of median female earnings, the demographic groups most similar to Mexicans are Spanish American Indian ($33,625, a difference of 0.12%), Choctaw ($33,775, a difference of 0.33%), Native/Alaskan ($33,806, a difference of 0.42%), Creek ($33,437, a difference of 0.68%), and Menominee ($33,894, a difference of 0.69%).
| Demographics | Rating | Rank | Median Female Earnings |
| Kiowa | 0.0 /100 | #326 | Tragic $34,074 |
| Cajuns | 0.0 /100 | #327 | Tragic $34,034 |
| Immigrants | Central America | 0.0 /100 | #328 | Tragic $33,953 |
| Hopi | 0.0 /100 | #329 | Tragic $33,932 |
| Menominee | 0.0 /100 | #330 | Tragic $33,894 |
| Natives/Alaskans | 0.0 /100 | #331 | Tragic $33,806 |
| Choctaw | 0.0 /100 | #332 | Tragic $33,775 |
| Mexicans | 0.0 /100 | #333 | Tragic $33,664 |
| Spanish American Indians | 0.0 /100 | #334 | Tragic $33,625 |
| Creek | 0.0 /100 | #335 | Tragic $33,437 |
| Ottawa | 0.0 /100 | #336 | Tragic $33,378 |
| Yakama | 0.0 /100 | #337 | Tragic $33,354 |
| Immigrants | Cuba | 0.0 /100 | #338 | Tragic $33,291 |
| Immigrants | Mexico | 0.0 /100 | #339 | Tragic $33,236 |
| Tohono O'odham | 0.0 /100 | #340 | Tragic $33,205 |
Demographics Similar to Paraguayans by Median Female Earnings
In terms of median female earnings, the demographic groups most similar to Paraguayans are Ethiopian ($43,243, a difference of 0.16%), Estonian ($43,106, a difference of 0.16%), Immigrants from Latvia ($43,099, a difference of 0.17%), Immigrants from Croatia ($43,258, a difference of 0.20%), and Immigrants from Bulgaria ($43,085, a difference of 0.20%).
| Demographics | Rating | Rank | Median Female Earnings |
| Maltese | 100.0 /100 | #51 | Exceptional $43,357 |
| Immigrants | Lithuania | 99.9 /100 | #52 | Exceptional $43,317 |
| Immigrants | Eastern Europe | 99.9 /100 | #53 | Exceptional $43,309 |
| Australians | 99.9 /100 | #54 | Exceptional $43,308 |
| Egyptians | 99.9 /100 | #55 | Exceptional $43,305 |
| Immigrants | Croatia | 99.9 /100 | #56 | Exceptional $43,258 |
| Ethiopians | 99.9 /100 | #57 | Exceptional $43,243 |
| Paraguayans | 99.9 /100 | #58 | Exceptional $43,173 |
| Estonians | 99.9 /100 | #59 | Exceptional $43,106 |
| Immigrants | Latvia | 99.9 /100 | #60 | Exceptional $43,099 |
| Immigrants | Bulgaria | 99.9 /100 | #61 | Exceptional $43,085 |
| Afghans | 99.9 /100 | #62 | Exceptional $43,077 |
| Immigrants | Ukraine | 99.9 /100 | #63 | Exceptional $43,069 |
| Immigrants | Pakistan | 99.9 /100 | #64 | Exceptional $43,052 |
| Sierra Leoneans | 99.9 /100 | #65 | Exceptional $42,868 |