Immigrants from Ethiopia vs Immigrants from Russia Householder Income Ages 45 - 64 years
COMPARE
Immigrants from Ethiopia
Immigrants from Russia
Householder Income Ages 45 - 64 years
Householder Income Ages 45 - 64 years Comparison
Immigrants from Ethiopia
Immigrants from Russia
$102,763
HOUSEHOLDER INCOME AGES 45 - 64 YEARS
77.3/ 100
METRIC RATING
157th/ 347
METRIC RANK
$113,215
HOUSEHOLDER INCOME AGES 45 - 64 YEARS
99.8/ 100
METRIC RATING
49th/ 347
METRIC RANK
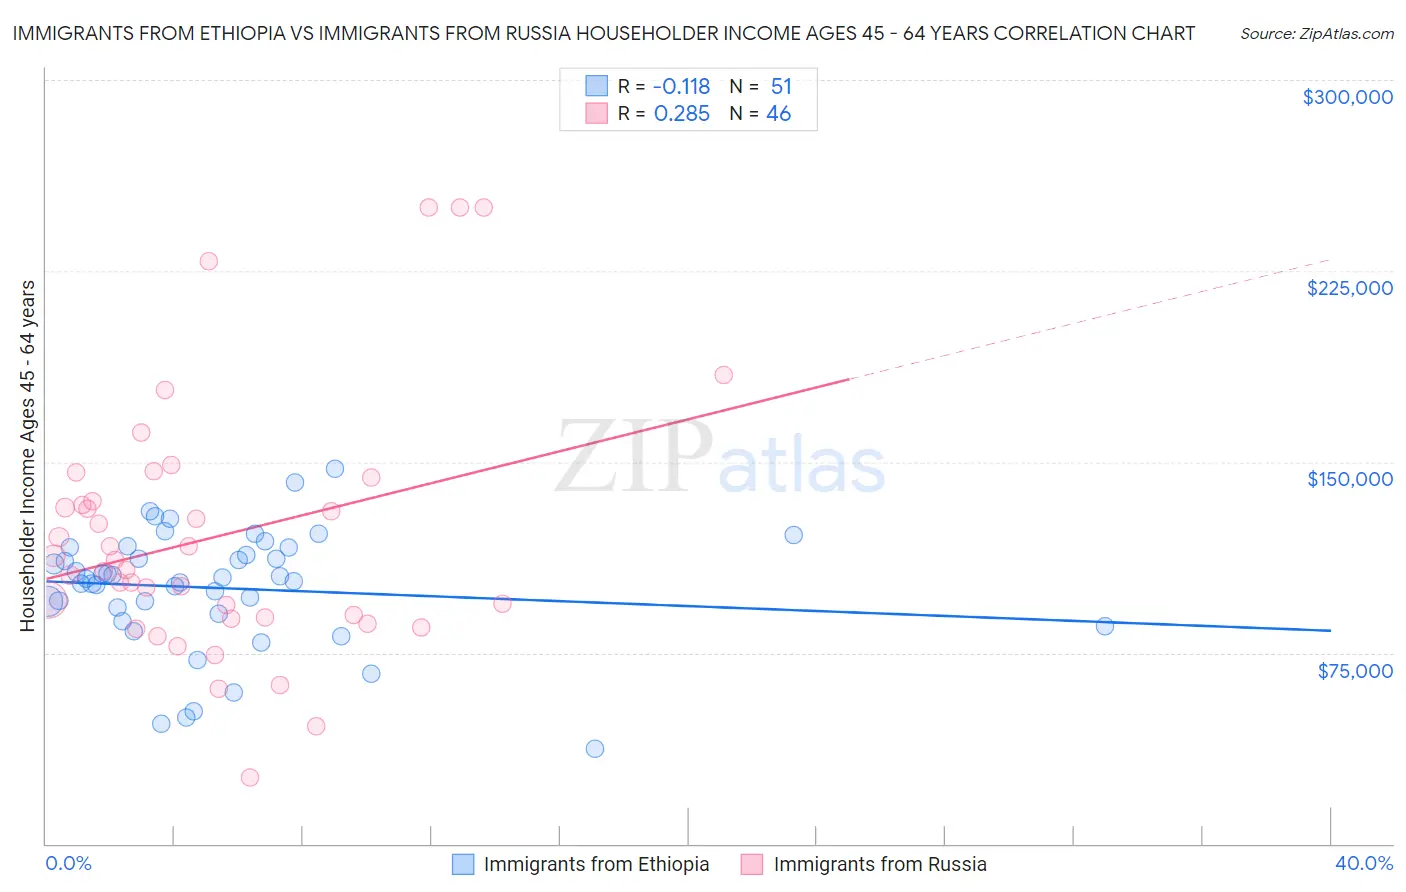
Immigrants from Ethiopia vs Immigrants from Russia Householder Income Ages 45 - 64 years Correlation Chart
The statistical analysis conducted on geographies consisting of 211,332,039 people shows a poor negative correlation between the proportion of Immigrants from Ethiopia and household income with householder between the ages 45 and 64 in the United States with a correlation coefficient (R) of -0.118 and weighted average of $102,763. Similarly, the statistical analysis conducted on geographies consisting of 347,427,203 people shows a weak positive correlation between the proportion of Immigrants from Russia and household income with householder between the ages 45 and 64 in the United States with a correlation coefficient (R) of 0.285 and weighted average of $113,215, a difference of 10.2%.
Householder Income Ages 45 - 64 years Correlation Summary
| Measurement | Immigrants from Ethiopia | Immigrants from Russia |
| Minimum | $37,206 | $26,250 |
| Maximum | $147,240 | $250,001 |
| Range | $110,034 | $223,751 |
| Mean | $100,387 | $120,532 |
| Median | $104,236 | $109,623 |
| Interquartile 25% (IQ1) | $90,455 | $89,063 |
| Interquartile 75% (IQ3) | $116,400 | $134,641 |
| Interquartile Range (IQR) | $25,945 | $45,578 |
| Standard Deviation (Sample) | $23,411 | $49,965 |
| Standard Deviation (Population) | $23,180 | $49,419 |
Similar Demographics by Householder Income Ages 45 - 64 years
Demographics Similar to Immigrants from Ethiopia by Householder Income Ages 45 - 64 years
In terms of householder income ages 45 - 64 years, the demographic groups most similar to Immigrants from Ethiopia are Carpatho Rusyn ($102,777, a difference of 0.010%), Costa Rican ($102,779, a difference of 0.020%), Slovene ($102,885, a difference of 0.12%), Slavic ($102,629, a difference of 0.13%), and Scandinavian ($102,969, a difference of 0.20%).
| Demographics | Rating | Rank | Householder Income Ages 45 - 64 years |
| Immigrants | Peru | 80.7 /100 | #150 | Excellent $103,173 |
| Swiss | 79.9 /100 | #151 | Good $103,071 |
| Irish | 79.8 /100 | #152 | Good $103,067 |
| Scandinavians | 79.0 /100 | #153 | Good $102,969 |
| Slovenes | 78.3 /100 | #154 | Good $102,885 |
| Costa Ricans | 77.4 /100 | #155 | Good $102,779 |
| Carpatho Rusyns | 77.4 /100 | #156 | Good $102,777 |
| Immigrants | Ethiopia | 77.3 /100 | #157 | Good $102,763 |
| Slavs | 76.1 /100 | #158 | Good $102,629 |
| Sierra Leoneans | 74.2 /100 | #159 | Good $102,427 |
| Icelanders | 72.5 /100 | #160 | Good $102,261 |
| Immigrants | Nepal | 71.8 /100 | #161 | Good $102,190 |
| Scottish | 71.1 /100 | #162 | Good $102,123 |
| English | 70.1 /100 | #163 | Good $102,021 |
| Immigrants | Morocco | 70.0 /100 | #164 | Good $102,015 |
Demographics Similar to Immigrants from Russia by Householder Income Ages 45 - 64 years
In terms of householder income ages 45 - 64 years, the demographic groups most similar to Immigrants from Russia are Immigrants from Austria ($113,140, a difference of 0.070%), Immigrants from Indonesia ($113,519, a difference of 0.27%), Australian ($113,533, a difference of 0.28%), Immigrants from Greece ($113,548, a difference of 0.29%), and Immigrants from South Africa ($112,886, a difference of 0.29%).
| Demographics | Rating | Rank | Householder Income Ages 45 - 64 years |
| Estonians | 99.9 /100 | #42 | Exceptional $114,220 |
| Israelis | 99.9 /100 | #43 | Exceptional $114,186 |
| Bulgarians | 99.9 /100 | #44 | Exceptional $113,883 |
| Immigrants | France | 99.9 /100 | #45 | Exceptional $113,680 |
| Immigrants | Greece | 99.9 /100 | #46 | Exceptional $113,548 |
| Australians | 99.9 /100 | #47 | Exceptional $113,533 |
| Immigrants | Indonesia | 99.9 /100 | #48 | Exceptional $113,519 |
| Immigrants | Russia | 99.8 /100 | #49 | Exceptional $113,215 |
| Immigrants | Austria | 99.8 /100 | #50 | Exceptional $113,140 |
| Immigrants | South Africa | 99.8 /100 | #51 | Exceptional $112,886 |
| Immigrants | Malaysia | 99.8 /100 | #52 | Exceptional $112,796 |
| Afghans | 99.8 /100 | #53 | Exceptional $112,676 |
| Greeks | 99.8 /100 | #54 | Exceptional $112,630 |
| Lithuanians | 99.8 /100 | #55 | Exceptional $112,484 |
| Egyptians | 99.7 /100 | #56 | Exceptional $112,256 |