Yugoslavian vs Immigrants from Ghana Householder Income Ages 45 - 64 years
COMPARE
Yugoslavian
Immigrants from Ghana
Householder Income Ages 45 - 64 years
Householder Income Ages 45 - 64 years Comparison
Yugoslavians
Immigrants from Ghana
$97,558
HOUSEHOLDER INCOME AGES 45 - 64 YEARS
20.0/ 100
METRIC RATING
201st/ 347
METRIC RANK
$94,982
HOUSEHOLDER INCOME AGES 45 - 64 YEARS
6.4/ 100
METRIC RATING
217th/ 347
METRIC RANK
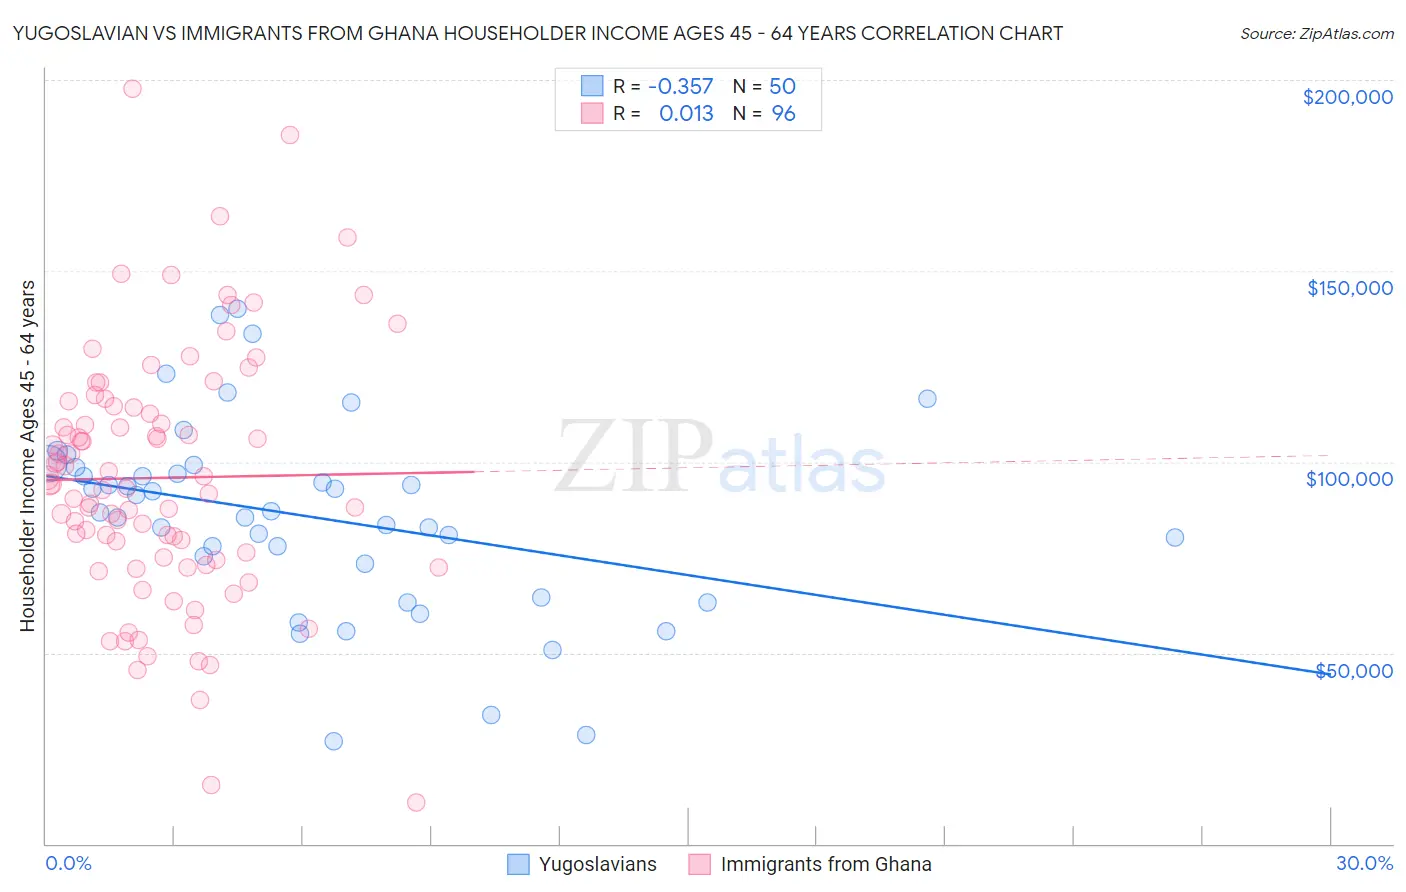
Yugoslavian vs Immigrants from Ghana Householder Income Ages 45 - 64 years Correlation Chart
The statistical analysis conducted on geographies consisting of 285,465,008 people shows a mild negative correlation between the proportion of Yugoslavians and household income with householder between the ages 45 and 64 in the United States with a correlation coefficient (R) of -0.357 and weighted average of $97,558. Similarly, the statistical analysis conducted on geographies consisting of 199,704,082 people shows no correlation between the proportion of Immigrants from Ghana and household income with householder between the ages 45 and 64 in the United States with a correlation coefficient (R) of 0.013 and weighted average of $94,982, a difference of 2.7%.
Householder Income Ages 45 - 64 years Correlation Summary
| Measurement | Yugoslavian | Immigrants from Ghana |
| Minimum | $26,989 | $10,938 |
| Maximum | $140,097 | $197,851 |
| Range | $113,108 | $186,913 |
| Mean | $85,735 | $95,814 |
| Median | $86,945 | $94,054 |
| Interquartile 25% (IQ1) | $73,466 | $74,592 |
| Interquartile 75% (IQ3) | $98,460 | $114,445 |
| Interquartile Range (IQR) | $24,994 | $39,852 |
| Standard Deviation (Sample) | $25,335 | $33,020 |
| Standard Deviation (Population) | $25,080 | $32,848 |
Demographics Similar to Yugoslavians and Immigrants from Ghana by Householder Income Ages 45 - 64 years
In terms of householder income ages 45 - 64 years, the demographic groups most similar to Yugoslavians are Tlingit-Haida ($97,417, a difference of 0.15%), Immigrants from Thailand ($97,400, a difference of 0.16%), Immigrants from Eritrea ($97,373, a difference of 0.19%), Immigrants from Colombia ($97,290, a difference of 0.28%), and Immigrants from Africa ($97,284, a difference of 0.28%). Similarly, the demographic groups most similar to Immigrants from Ghana are Delaware ($94,914, a difference of 0.070%), Immigrants from Armenia ($94,863, a difference of 0.13%), Immigrants from Venezuela ($95,342, a difference of 0.38%), Nigerian ($95,492, a difference of 0.54%), and Panamanian ($96,066, a difference of 1.1%).
| Demographics | Rating | Rank | Householder Income Ages 45 - 64 years |
| Whites/Caucasians | 24.6 /100 | #199 | Fair $98,091 |
| Immigrants | Kenya | 23.5 /100 | #200 | Fair $97,964 |
| Yugoslavians | 20.0 /100 | #201 | Fair $97,558 |
| Tlingit-Haida | 18.9 /100 | #202 | Poor $97,417 |
| Immigrants | Thailand | 18.8 /100 | #203 | Poor $97,400 |
| Immigrants | Eritrea | 18.6 /100 | #204 | Poor $97,373 |
| Immigrants | Colombia | 18.0 /100 | #205 | Poor $97,290 |
| Immigrants | Africa | 17.9 /100 | #206 | Poor $97,284 |
| Ghanaians | 17.9 /100 | #207 | Poor $97,277 |
| Scotch-Irish | 16.4 /100 | #208 | Poor $97,073 |
| Japanese | 14.8 /100 | #209 | Poor $96,834 |
| Tsimshian | 14.5 /100 | #210 | Poor $96,783 |
| Immigrants | Cambodia | 13.0 /100 | #211 | Poor $96,537 |
| Venezuelans | 12.6 /100 | #212 | Poor $96,460 |
| Immigrants | Uruguay | 10.7 /100 | #213 | Poor $96,086 |
| Panamanians | 10.6 /100 | #214 | Poor $96,066 |
| Nigerians | 8.2 /100 | #215 | Tragic $95,492 |
| Immigrants | Venezuela | 7.6 /100 | #216 | Tragic $95,342 |
| Immigrants | Ghana | 6.4 /100 | #217 | Tragic $94,982 |
| Delaware | 6.2 /100 | #218 | Tragic $94,914 |
| Immigrants | Armenia | 6.1 /100 | #219 | Tragic $94,863 |