Nigerian vs Swedish Median Female Earnings
COMPARE
Nigerian
Swedish
Median Female Earnings
Median Female Earnings Comparison
Nigerians
Swedes
$39,641
MEDIAN FEMALE EARNINGS
47.0/ 100
METRIC RATING
176th/ 347
METRIC RANK
$39,421
MEDIAN FEMALE EARNINGS
36.0/ 100
METRIC RATING
187th/ 347
METRIC RANK
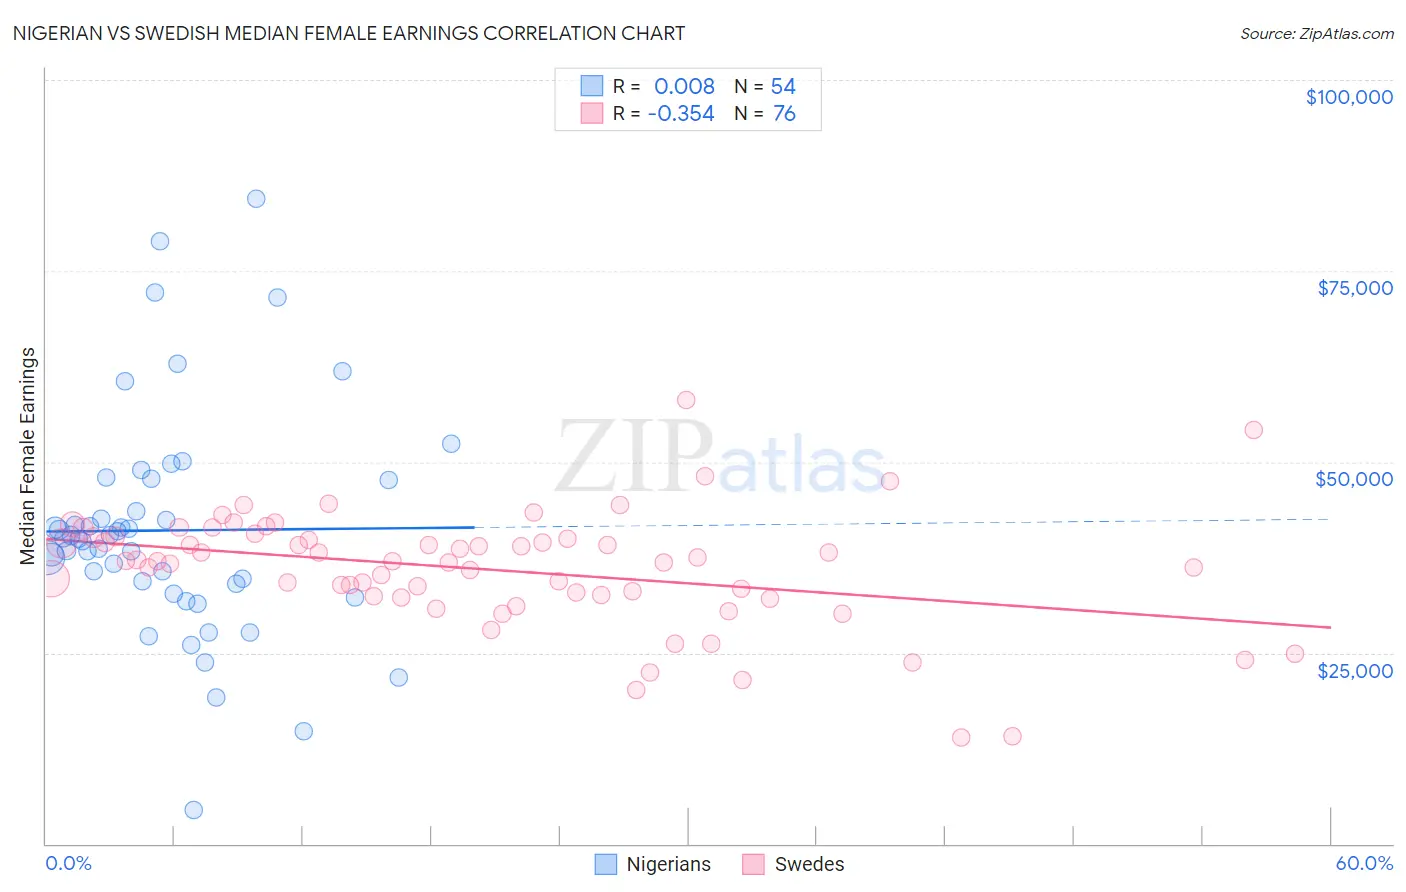
Nigerian vs Swedish Median Female Earnings Correlation Chart
The statistical analysis conducted on geographies consisting of 332,727,329 people shows no correlation between the proportion of Nigerians and median female earnings in the United States with a correlation coefficient (R) of 0.008 and weighted average of $39,641. Similarly, the statistical analysis conducted on geographies consisting of 538,112,894 people shows a mild negative correlation between the proportion of Swedes and median female earnings in the United States with a correlation coefficient (R) of -0.354 and weighted average of $39,421, a difference of 0.56%.
Median Female Earnings Correlation Summary
| Measurement | Nigerian | Swedish |
| Minimum | $4,391 | $13,839 |
| Maximum | $84,500 | $58,087 |
| Range | $80,109 | $44,248 |
| Mean | $41,029 | $35,925 |
| Median | $39,924 | $36,993 |
| Interquartile 25% (IQ1) | $33,961 | $32,470 |
| Interquartile 75% (IQ3) | $47,567 | $39,982 |
| Interquartile Range (IQR) | $13,606 | $7,512 |
| Standard Deviation (Sample) | $14,779 | $7,648 |
| Standard Deviation (Population) | $14,642 | $7,597 |
Demographics Similar to Nigerians and Swedes by Median Female Earnings
In terms of median female earnings, the demographic groups most similar to Nigerians are Immigrants from South America ($39,643, a difference of 0.010%), Costa Rican ($39,622, a difference of 0.050%), Slavic ($39,613, a difference of 0.070%), Immigrants from Germany ($39,603, a difference of 0.10%), and South American ($39,698, a difference of 0.14%). Similarly, the demographic groups most similar to Swedes are Bermudan ($39,418, a difference of 0.010%), Immigrants from West Indies ($39,441, a difference of 0.050%), Colombian ($39,439, a difference of 0.050%), European ($39,457, a difference of 0.090%), and Senegalese ($39,384, a difference of 0.090%).
| Demographics | Rating | Rank | Median Female Earnings |
| Immigrants | Portugal | 54.7 /100 | #171 | Average $39,788 |
| British | 53.8 /100 | #172 | Average $39,772 |
| Canadians | 51.4 /100 | #173 | Average $39,724 |
| South Americans | 50.0 /100 | #174 | Average $39,698 |
| Immigrants | South America | 47.2 /100 | #175 | Average $39,643 |
| Nigerians | 47.0 /100 | #176 | Average $39,641 |
| Costa Ricans | 46.1 /100 | #177 | Average $39,622 |
| Slavs | 45.6 /100 | #178 | Average $39,613 |
| Immigrants | Germany | 45.1 /100 | #179 | Average $39,603 |
| Immigrants | Kenya | 41.6 /100 | #180 | Average $39,535 |
| Tsimshian | 41.4 /100 | #181 | Average $39,530 |
| Tlingit-Haida | 40.5 /100 | #182 | Average $39,513 |
| Hungarians | 40.3 /100 | #183 | Average $39,510 |
| Europeans | 37.7 /100 | #184 | Fair $39,457 |
| Immigrants | West Indies | 36.9 /100 | #185 | Fair $39,441 |
| Colombians | 36.9 /100 | #186 | Fair $39,439 |
| Swedes | 36.0 /100 | #187 | Fair $39,421 |
| Bermudans | 35.9 /100 | #188 | Fair $39,418 |
| Senegalese | 34.2 /100 | #189 | Fair $39,384 |
| Puget Sound Salish | 33.9 /100 | #190 | Fair $39,376 |
| Immigrants | Western Africa | 32.7 /100 | #191 | Fair $39,351 |