Luxembourger vs Swedish Median Female Earnings
COMPARE
Luxembourger
Swedish
Median Female Earnings
Median Female Earnings Comparison
Luxembourgers
Swedes
$39,891
MEDIAN FEMALE EARNINGS
59.9/ 100
METRIC RATING
167th/ 347
METRIC RANK
$39,421
MEDIAN FEMALE EARNINGS
36.0/ 100
METRIC RATING
187th/ 347
METRIC RANK
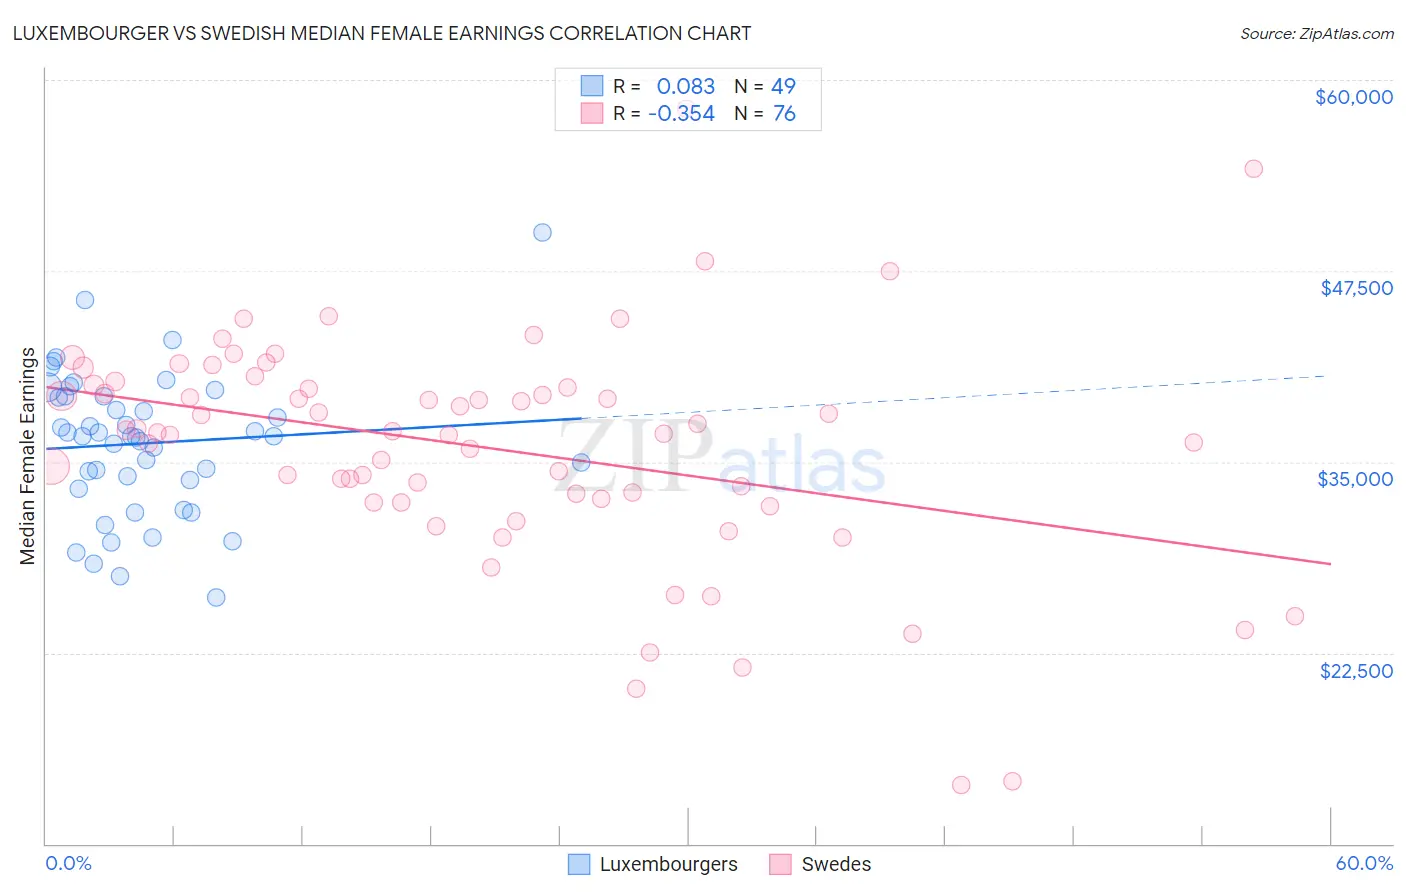
Luxembourger vs Swedish Median Female Earnings Correlation Chart
The statistical analysis conducted on geographies consisting of 144,650,946 people shows a slight positive correlation between the proportion of Luxembourgers and median female earnings in the United States with a correlation coefficient (R) of 0.083 and weighted average of $39,891. Similarly, the statistical analysis conducted on geographies consisting of 538,112,894 people shows a mild negative correlation between the proportion of Swedes and median female earnings in the United States with a correlation coefficient (R) of -0.354 and weighted average of $39,421, a difference of 1.2%.
Median Female Earnings Correlation Summary
| Measurement | Luxembourger | Swedish |
| Minimum | $26,088 | $13,839 |
| Maximum | $50,000 | $58,087 |
| Range | $23,912 | $44,248 |
| Mean | $36,224 | $35,925 |
| Median | $36,648 | $36,993 |
| Interquartile 25% (IQ1) | $33,540 | $32,470 |
| Interquartile 75% (IQ3) | $39,298 | $39,982 |
| Interquartile Range (IQR) | $5,758 | $7,512 |
| Standard Deviation (Sample) | $4,701 | $7,648 |
| Standard Deviation (Population) | $4,653 | $7,597 |
Demographics Similar to Luxembourgers and Swedes by Median Female Earnings
In terms of median female earnings, the demographic groups most similar to Luxembourgers are Immigrants from Peru ($39,871, a difference of 0.050%), Kenyan ($39,860, a difference of 0.080%), Slovene ($39,817, a difference of 0.19%), Immigrants from Portugal ($39,788, a difference of 0.26%), and British ($39,772, a difference of 0.30%). Similarly, the demographic groups most similar to Swedes are Immigrants from West Indies ($39,441, a difference of 0.050%), Colombian ($39,439, a difference of 0.050%), European ($39,457, a difference of 0.090%), Tlingit-Haida ($39,513, a difference of 0.23%), and Hungarian ($39,510, a difference of 0.23%).
| Demographics | Rating | Rank | Median Female Earnings |
| Luxembourgers | 59.9 /100 | #167 | Average $39,891 |
| Immigrants | Peru | 58.9 /100 | #168 | Average $39,871 |
| Kenyans | 58.4 /100 | #169 | Average $39,860 |
| Slovenes | 56.2 /100 | #170 | Average $39,817 |
| Immigrants | Portugal | 54.7 /100 | #171 | Average $39,788 |
| British | 53.8 /100 | #172 | Average $39,772 |
| Canadians | 51.4 /100 | #173 | Average $39,724 |
| South Americans | 50.0 /100 | #174 | Average $39,698 |
| Immigrants | South America | 47.2 /100 | #175 | Average $39,643 |
| Nigerians | 47.0 /100 | #176 | Average $39,641 |
| Costa Ricans | 46.1 /100 | #177 | Average $39,622 |
| Slavs | 45.6 /100 | #178 | Average $39,613 |
| Immigrants | Germany | 45.1 /100 | #179 | Average $39,603 |
| Immigrants | Kenya | 41.6 /100 | #180 | Average $39,535 |
| Tsimshian | 41.4 /100 | #181 | Average $39,530 |
| Tlingit-Haida | 40.5 /100 | #182 | Average $39,513 |
| Hungarians | 40.3 /100 | #183 | Average $39,510 |
| Europeans | 37.7 /100 | #184 | Fair $39,457 |
| Immigrants | West Indies | 36.9 /100 | #185 | Fair $39,441 |
| Colombians | 36.9 /100 | #186 | Fair $39,439 |
| Swedes | 36.0 /100 | #187 | Fair $39,421 |