Greek vs Colombian Householder Income Under 25 years
COMPARE
Greek
Colombian
Householder Income Under 25 years
Householder Income Under 25 years Comparison
Greeks
Colombians
$53,715
HOUSEHOLDER INCOME UNDER 25 YEARS
97.7/ 100
METRIC RATING
110th/ 347
METRIC RANK
$53,357
HOUSEHOLDER INCOME UNDER 25 YEARS
94.6/ 100
METRIC RATING
124th/ 347
METRIC RANK
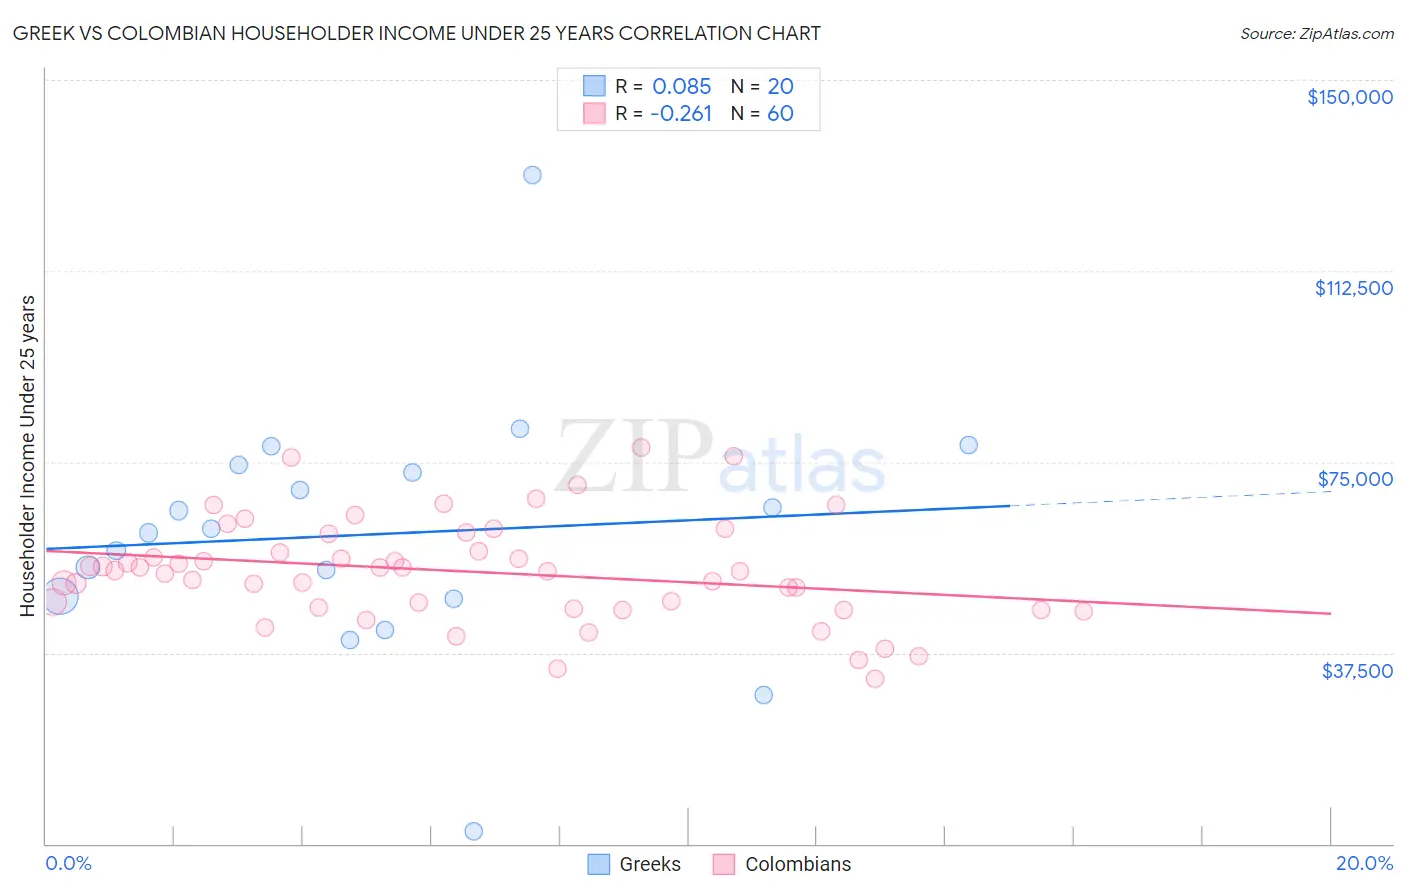
Greek vs Colombian Householder Income Under 25 years Correlation Chart
The statistical analysis conducted on geographies consisting of 391,360,962 people shows a slight positive correlation between the proportion of Greeks and household income with householder under the age of 25 in the United States with a correlation coefficient (R) of 0.085 and weighted average of $53,715. Similarly, the statistical analysis conducted on geographies consisting of 350,831,291 people shows a weak negative correlation between the proportion of Colombians and household income with householder under the age of 25 in the United States with a correlation coefficient (R) of -0.261 and weighted average of $53,357, a difference of 0.67%.
Householder Income Under 25 years Correlation Summary
| Measurement | Greek | Colombian |
| Minimum | $2,499 | $32,315 |
| Maximum | $131,250 | $77,798 |
| Range | $128,751 | $45,483 |
| Mean | $60,821 | $53,495 |
| Median | $61,415 | $53,679 |
| Interquartile 25% (IQ1) | $48,366 | $46,265 |
| Interquartile 75% (IQ3) | $73,725 | $59,118 |
| Interquartile Range (IQR) | $25,359 | $12,853 |
| Standard Deviation (Sample) | $25,180 | $10,089 |
| Standard Deviation (Population) | $24,542 | $10,004 |
Demographics Similar to Greeks and Colombians by Householder Income Under 25 years
In terms of householder income under 25 years, the demographic groups most similar to Greeks are Immigrants from Colombia ($53,714, a difference of 0.0%), Immigrants from Ecuador ($53,722, a difference of 0.010%), Australian ($53,739, a difference of 0.040%), Maltese ($53,735, a difference of 0.040%), and Immigrants from Oceania ($53,680, a difference of 0.070%). Similarly, the demographic groups most similar to Colombians are Immigrants from Iraq ($53,384, a difference of 0.050%), Pakistani ($53,325, a difference of 0.060%), Immigrants from Serbia ($53,321, a difference of 0.070%), Immigrants from North America ($53,307, a difference of 0.090%), and Immigrants from Canada ($53,411, a difference of 0.10%).
| Demographics | Rating | Rank | Householder Income Under 25 years |
| Australians | 97.8 /100 | #107 | Exceptional $53,739 |
| Maltese | 97.8 /100 | #108 | Exceptional $53,735 |
| Immigrants | Ecuador | 97.7 /100 | #109 | Exceptional $53,722 |
| Greeks | 97.7 /100 | #110 | Exceptional $53,715 |
| Immigrants | Colombia | 97.7 /100 | #111 | Exceptional $53,714 |
| Immigrants | Oceania | 97.5 /100 | #112 | Exceptional $53,680 |
| Romanians | 97.2 /100 | #113 | Exceptional $53,632 |
| Immigrants | Sweden | 97.1 /100 | #114 | Exceptional $53,621 |
| Immigrants | Albania | 96.9 /100 | #115 | Exceptional $53,597 |
| Immigrants | Spain | 96.6 /100 | #116 | Exceptional $53,560 |
| Lithuanians | 96.6 /100 | #117 | Exceptional $53,552 |
| Immigrants | Switzerland | 96.3 /100 | #118 | Exceptional $53,528 |
| Italians | 95.4 /100 | #119 | Exceptional $53,426 |
| Guamanians/Chamorros | 95.3 /100 | #120 | Exceptional $53,423 |
| Immigrants | Canada | 95.2 /100 | #121 | Exceptional $53,411 |
| Immigrants | Ethiopia | 95.2 /100 | #122 | Exceptional $53,408 |
| Immigrants | Iraq | 94.9 /100 | #123 | Exceptional $53,384 |
| Colombians | 94.6 /100 | #124 | Exceptional $53,357 |
| Pakistanis | 94.1 /100 | #125 | Exceptional $53,325 |
| Immigrants | Serbia | 94.1 /100 | #126 | Exceptional $53,321 |
| Immigrants | North America | 93.9 /100 | #127 | Exceptional $53,307 |