Yakama vs Arab Householder Income Ages 45 - 64 years
COMPARE
Yakama
Arab
Householder Income Ages 45 - 64 years
Householder Income Ages 45 - 64 years Comparison
Yakama
Arabs
$86,992
HOUSEHOLDER INCOME AGES 45 - 64 YEARS
0.1/ 100
METRIC RATING
279th/ 347
METRIC RANK
$104,566
HOUSEHOLDER INCOME AGES 45 - 64 YEARS
89.3/ 100
METRIC RATING
133rd/ 347
METRIC RANK
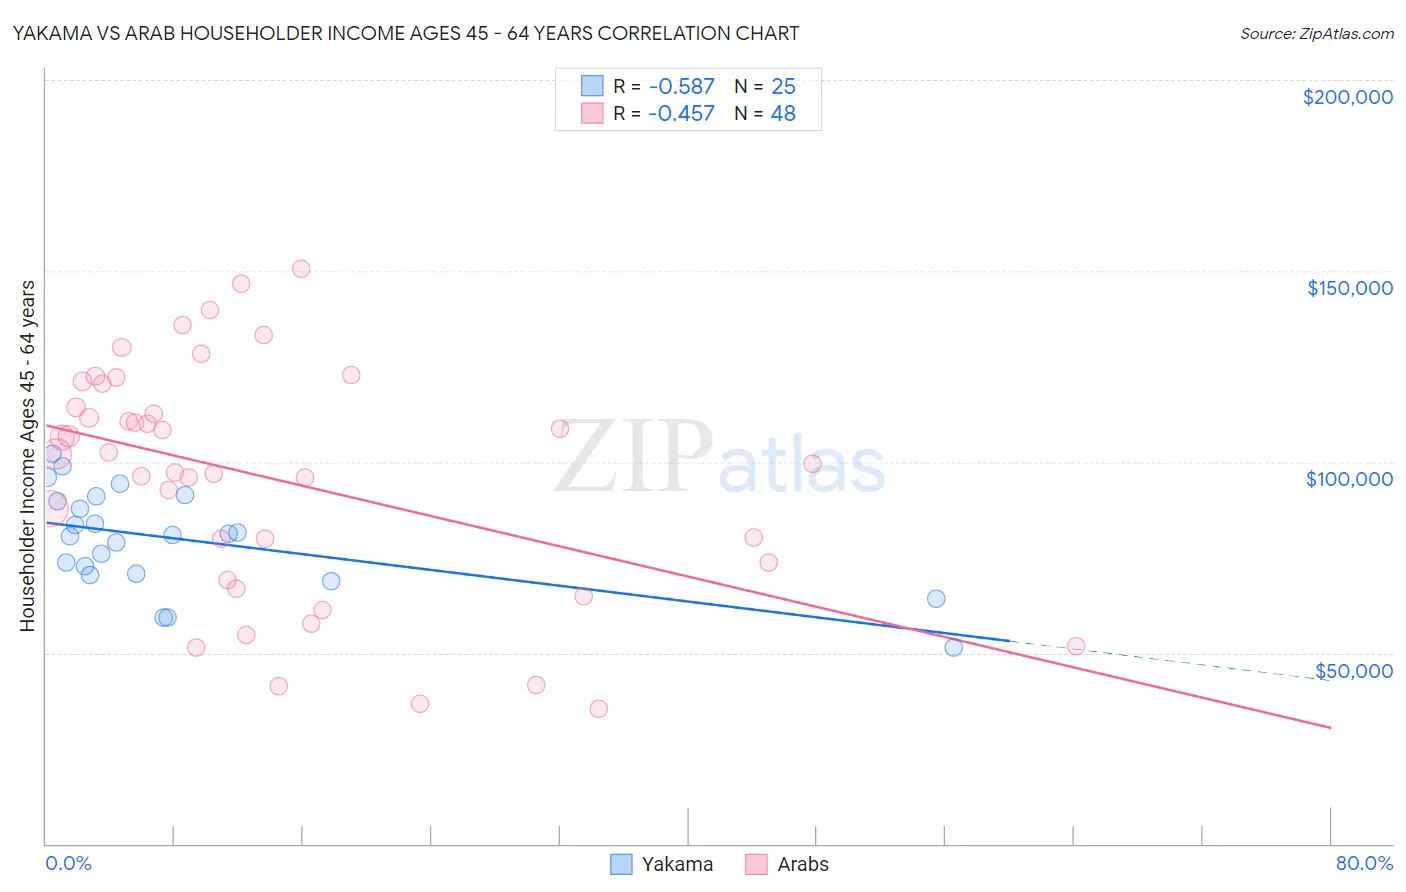
Yakama vs Arab Householder Income Ages 45 - 64 years Correlation Chart
The statistical analysis conducted on geographies consisting of 19,897,154 people shows a substantial negative correlation between the proportion of Yakama and household income with householder between the ages 45 and 64 in the United States with a correlation coefficient (R) of -0.587 and weighted average of $86,992. Similarly, the statistical analysis conducted on geographies consisting of 485,614,967 people shows a moderate negative correlation between the proportion of Arabs and household income with householder between the ages 45 and 64 in the United States with a correlation coefficient (R) of -0.457 and weighted average of $104,566, a difference of 20.2%.
Householder Income Ages 45 - 64 years Correlation Summary
| Measurement | Yakama | Arab |
| Minimum | $51,250 | $35,250 |
| Maximum | $102,065 | $150,539 |
| Range | $50,815 | $115,289 |
| Mean | $79,495 | $95,530 |
| Median | $80,929 | $100,868 |
| Interquartile 25% (IQ1) | $70,556 | $71,485 |
| Interquartile 75% (IQ3) | $90,396 | $117,419 |
| Interquartile Range (IQR) | $19,840 | $45,934 |
| Standard Deviation (Sample) | $13,031 | $30,403 |
| Standard Deviation (Population) | $12,768 | $30,085 |
Similar Demographics by Householder Income Ages 45 - 64 years
Demographics Similar to Yakama by Householder Income Ages 45 - 64 years
In terms of householder income ages 45 - 64 years, the demographic groups most similar to Yakama are Immigrants from Somalia ($86,987, a difference of 0.010%), Immigrants from Jamaica ($87,035, a difference of 0.050%), Yaqui ($86,914, a difference of 0.090%), Senegalese ($86,897, a difference of 0.11%), and Mexican ($86,816, a difference of 0.20%).
| Demographics | Rating | Rank | Householder Income Ages 45 - 64 years |
| Cape Verdeans | 0.2 /100 | #272 | Tragic $87,580 |
| Spanish American Indians | 0.2 /100 | #273 | Tragic $87,561 |
| Iroquois | 0.1 /100 | #274 | Tragic $87,255 |
| Immigrants | Belize | 0.1 /100 | #275 | Tragic $87,229 |
| Immigrants | Latin America | 0.1 /100 | #276 | Tragic $87,219 |
| Cree | 0.1 /100 | #277 | Tragic $87,185 |
| Immigrants | Jamaica | 0.1 /100 | #278 | Tragic $87,035 |
| Yakama | 0.1 /100 | #279 | Tragic $86,992 |
| Immigrants | Somalia | 0.1 /100 | #280 | Tragic $86,987 |
| Yaqui | 0.1 /100 | #281 | Tragic $86,914 |
| Senegalese | 0.1 /100 | #282 | Tragic $86,897 |
| Mexicans | 0.1 /100 | #283 | Tragic $86,816 |
| Central American Indians | 0.1 /100 | #284 | Tragic $86,764 |
| Blackfeet | 0.1 /100 | #285 | Tragic $86,595 |
| Immigrants | Guatemala | 0.1 /100 | #286 | Tragic $86,573 |
Demographics Similar to Arabs by Householder Income Ages 45 - 64 years
In terms of householder income ages 45 - 64 years, the demographic groups most similar to Arabs are Canadian ($104,560, a difference of 0.010%), Brazilian ($104,408, a difference of 0.15%), Lebanese ($104,734, a difference of 0.16%), Immigrants from Syria ($104,858, a difference of 0.28%), and Taiwanese ($104,180, a difference of 0.37%).
| Demographics | Rating | Rank | Householder Income Ages 45 - 64 years |
| Portuguese | 92.4 /100 | #126 | Exceptional $105,309 |
| Immigrants | Saudi Arabia | 92.2 /100 | #127 | Exceptional $105,249 |
| Native Hawaiians | 91.8 /100 | #128 | Exceptional $105,149 |
| Peruvians | 91.5 /100 | #129 | Exceptional $105,070 |
| Immigrants | Zimbabwe | 91.2 /100 | #130 | Exceptional $104,992 |
| Immigrants | Syria | 90.7 /100 | #131 | Exceptional $104,858 |
| Lebanese | 90.1 /100 | #132 | Exceptional $104,734 |
| Arabs | 89.3 /100 | #133 | Excellent $104,566 |
| Canadians | 89.3 /100 | #134 | Excellent $104,560 |
| Brazilians | 88.6 /100 | #135 | Excellent $104,408 |
| Taiwanese | 87.4 /100 | #136 | Excellent $104,180 |
| Hungarians | 85.8 /100 | #137 | Excellent $103,913 |
| Ethiopians | 84.7 /100 | #138 | Excellent $103,736 |
| Immigrants | Oceania | 84.5 /100 | #139 | Excellent $103,705 |
| Norwegians | 84.3 /100 | #140 | Excellent $103,682 |