Yakama vs Creek Median Male Earnings
COMPARE
Yakama
Creek
Median Male Earnings
Median Male Earnings Comparison
Yakama
Creek
$45,002
MEDIAN MALE EARNINGS
0.0/ 100
METRIC RATING
329th/ 347
METRIC RANK
$46,594
MEDIAN MALE EARNINGS
0.0/ 100
METRIC RATING
309th/ 347
METRIC RANK
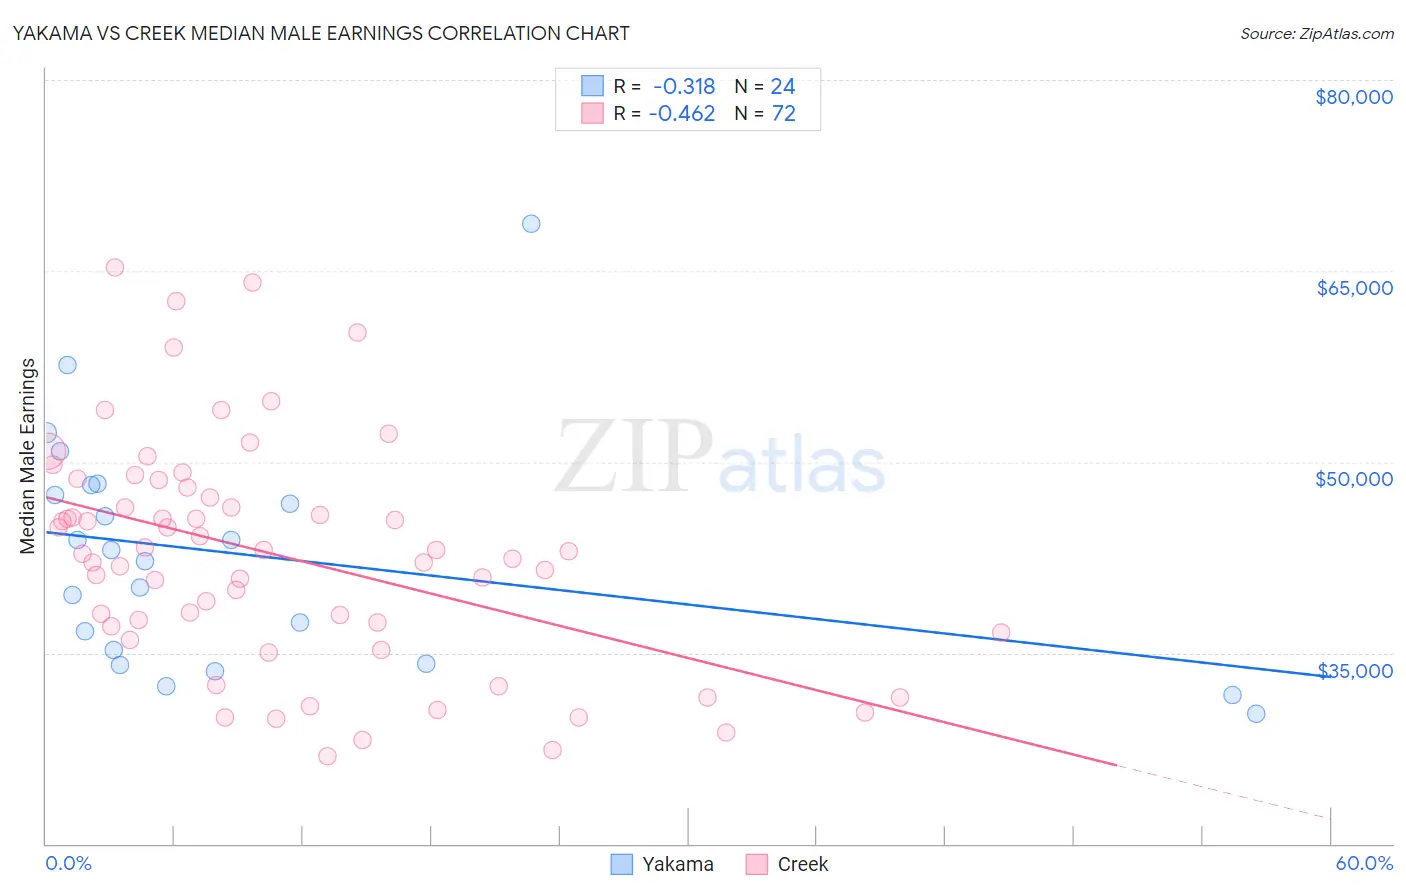
Yakama vs Creek Median Male Earnings Correlation Chart
The statistical analysis conducted on geographies consisting of 19,920,033 people shows a mild negative correlation between the proportion of Yakama and median male earnings in the United States with a correlation coefficient (R) of -0.318 and weighted average of $45,002. Similarly, the statistical analysis conducted on geographies consisting of 178,430,593 people shows a moderate negative correlation between the proportion of Creek and median male earnings in the United States with a correlation coefficient (R) of -0.462 and weighted average of $46,594, a difference of 3.5%.
Median Male Earnings Correlation Summary
| Measurement | Yakama | Creek |
| Minimum | $30,179 | $26,855 |
| Maximum | $68,750 | $65,299 |
| Range | $38,571 | $38,444 |
| Mean | $42,657 | $42,595 |
| Median | $42,664 | $42,837 |
| Interquartile 25% (IQ1) | $34,669 | $36,835 |
| Interquartile 75% (IQ3) | $47,788 | $47,588 |
| Interquartile Range (IQR) | $13,119 | $10,753 |
| Standard Deviation (Sample) | $9,142 | $8,932 |
| Standard Deviation (Population) | $8,950 | $8,870 |
Demographics Similar to Yakama and Creek by Median Male Earnings
In terms of median male earnings, the demographic groups most similar to Yakama are Kiowa ($45,094, a difference of 0.20%), Immigrants from Bahamas ($45,176, a difference of 0.39%), Immigrants from Haiti ($45,266, a difference of 0.59%), Yuman ($45,446, a difference of 0.99%), and Black/African American ($45,523, a difference of 1.2%). Similarly, the demographic groups most similar to Creek are Cuban ($46,580, a difference of 0.030%), Apache ($46,429, a difference of 0.36%), Hispanic or Latino ($46,419, a difference of 0.38%), Honduran ($46,374, a difference of 0.48%), and Chippewa ($46,368, a difference of 0.49%).
| Demographics | Rating | Rank | Median Male Earnings |
| Creek | 0.0 /100 | #309 | Tragic $46,594 |
| Cubans | 0.0 /100 | #310 | Tragic $46,580 |
| Apache | 0.0 /100 | #311 | Tragic $46,429 |
| Hispanics or Latinos | 0.0 /100 | #312 | Tragic $46,419 |
| Hondurans | 0.0 /100 | #313 | Tragic $46,374 |
| Chippewa | 0.0 /100 | #314 | Tragic $46,368 |
| Immigrants | Guatemala | 0.0 /100 | #315 | Tragic $46,244 |
| Immigrants | Caribbean | 0.0 /100 | #316 | Tragic $46,193 |
| Mexicans | 0.0 /100 | #317 | Tragic $46,147 |
| Cheyenne | 0.0 /100 | #318 | Tragic $46,062 |
| Haitians | 0.0 /100 | #319 | Tragic $45,903 |
| Immigrants | Honduras | 0.0 /100 | #320 | Tragic $45,787 |
| Fijians | 0.0 /100 | #321 | Tragic $45,607 |
| Sioux | 0.0 /100 | #322 | Tragic $45,566 |
| Immigrants | Central America | 0.0 /100 | #323 | Tragic $45,538 |
| Blacks/African Americans | 0.0 /100 | #324 | Tragic $45,523 |
| Yuman | 0.0 /100 | #325 | Tragic $45,446 |
| Immigrants | Haiti | 0.0 /100 | #326 | Tragic $45,266 |
| Immigrants | Bahamas | 0.0 /100 | #327 | Tragic $45,176 |
| Kiowa | 0.0 /100 | #328 | Tragic $45,094 |
| Yakama | 0.0 /100 | #329 | Tragic $45,002 |