Indonesian vs Bolivian Median Household Income
COMPARE
Indonesian
Bolivian
Median Household Income
Median Household Income Comparison
Indonesians
Bolivians
$72,856
MEDIAN HOUSEHOLD INCOME
0.0/ 100
METRIC RATING
299th/ 347
METRIC RANK
$102,195
MEDIAN HOUSEHOLD INCOME
100.0/ 100
METRIC RATING
20th/ 347
METRIC RANK
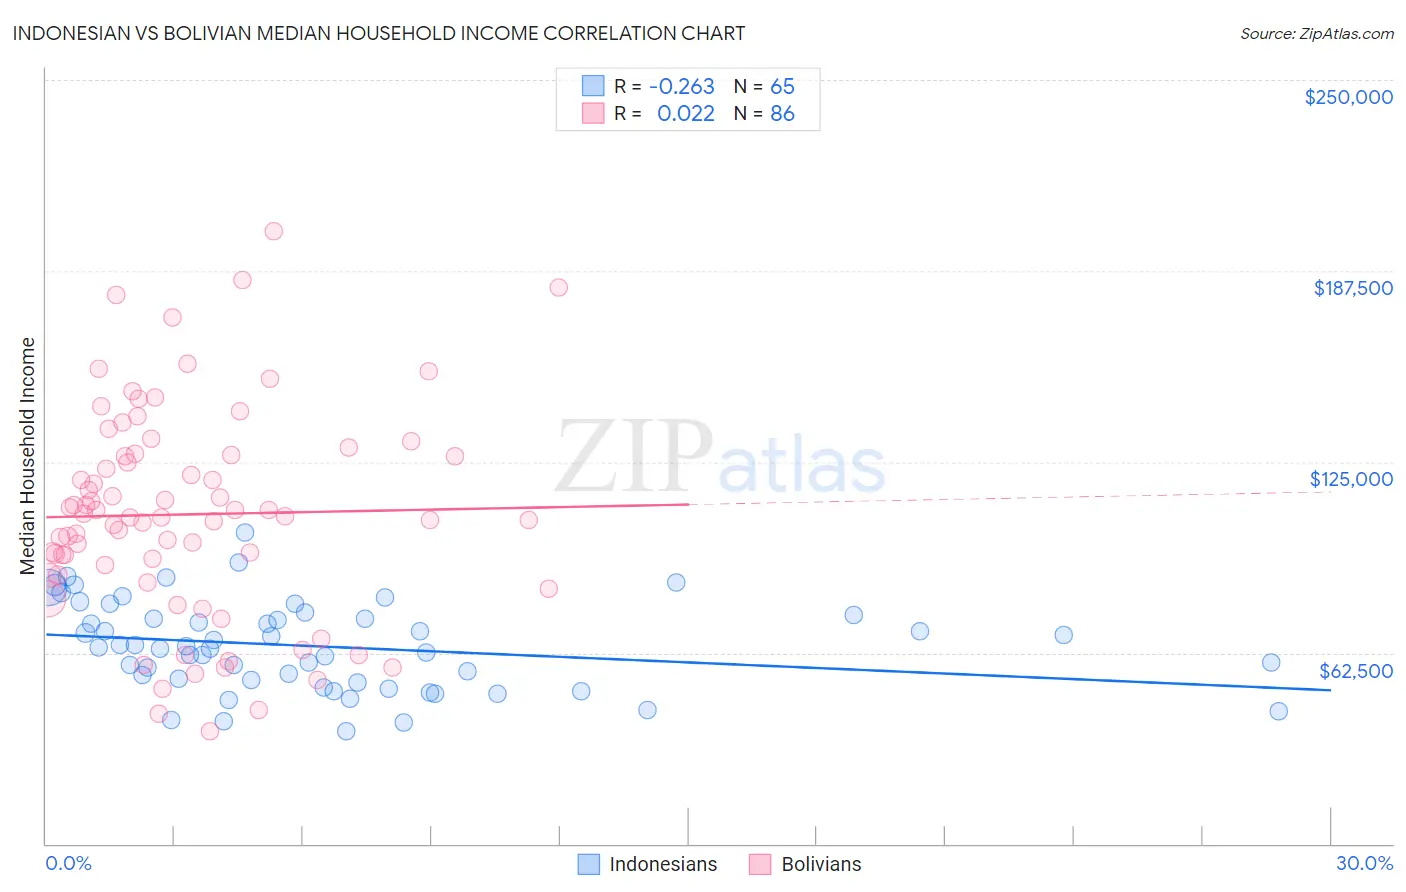
Indonesian vs Bolivian Median Household Income Correlation Chart
The statistical analysis conducted on geographies consisting of 162,609,195 people shows a weak negative correlation between the proportion of Indonesians and median household income in the United States with a correlation coefficient (R) of -0.263 and weighted average of $72,856. Similarly, the statistical analysis conducted on geographies consisting of 184,606,856 people shows no correlation between the proportion of Bolivians and median household income in the United States with a correlation coefficient (R) of 0.022 and weighted average of $102,195, a difference of 40.3%.
Median Household Income Correlation Summary
| Measurement | Indonesian | Bolivian |
| Minimum | $36,966 | $36,777 |
| Maximum | $101,767 | $200,625 |
| Range | $64,801 | $163,848 |
| Mean | $64,599 | $107,810 |
| Median | $64,081 | $106,861 |
| Interquartile 25% (IQ1) | $53,194 | $87,882 |
| Interquartile 75% (IQ3) | $74,214 | $127,141 |
| Interquartile Range (IQR) | $21,021 | $39,259 |
| Standard Deviation (Sample) | $14,432 | $34,248 |
| Standard Deviation (Population) | $14,321 | $34,049 |
Similar Demographics by Median Household Income
Demographics Similar to Indonesians by Median Household Income
In terms of median household income, the demographic groups most similar to Indonesians are Immigrants from Dominica ($72,760, a difference of 0.13%), Paiute ($72,959, a difference of 0.14%), Cherokee ($72,682, a difference of 0.24%), Shoshone ($72,660, a difference of 0.27%), and African ($72,650, a difference of 0.28%).
| Demographics | Rating | Rank | Median Household Income |
| Comanche | 0.1 /100 | #292 | Tragic $73,747 |
| Immigrants | Cabo Verde | 0.1 /100 | #293 | Tragic $73,515 |
| Blackfeet | 0.1 /100 | #294 | Tragic $73,509 |
| Cubans | 0.1 /100 | #295 | Tragic $73,392 |
| Haitians | 0.1 /100 | #296 | Tragic $73,306 |
| Immigrants | Mexico | 0.0 /100 | #297 | Tragic $73,160 |
| Paiute | 0.0 /100 | #298 | Tragic $72,959 |
| Indonesians | 0.0 /100 | #299 | Tragic $72,856 |
| Immigrants | Dominica | 0.0 /100 | #300 | Tragic $72,760 |
| Cherokee | 0.0 /100 | #301 | Tragic $72,682 |
| Shoshone | 0.0 /100 | #302 | Tragic $72,660 |
| Africans | 0.0 /100 | #303 | Tragic $72,650 |
| Immigrants | Haiti | 0.0 /100 | #304 | Tragic $72,599 |
| Hondurans | 0.0 /100 | #305 | Tragic $72,588 |
| Potawatomi | 0.0 /100 | #306 | Tragic $72,576 |
Demographics Similar to Bolivians by Median Household Income
In terms of median household income, the demographic groups most similar to Bolivians are Immigrants from Australia ($102,562, a difference of 0.36%), Eastern European ($101,781, a difference of 0.41%), Asian ($101,681, a difference of 0.50%), Cypriot ($102,843, a difference of 0.63%), and Immigrants from Korea ($102,962, a difference of 0.75%).
| Demographics | Rating | Rank | Median Household Income |
| Immigrants | Eastern Asia | 100.0 /100 | #13 | Exceptional $104,796 |
| Immigrants | Ireland | 100.0 /100 | #14 | Exceptional $104,692 |
| Immigrants | Israel | 100.0 /100 | #15 | Exceptional $104,090 |
| Burmese | 100.0 /100 | #16 | Exceptional $103,145 |
| Immigrants | Korea | 100.0 /100 | #17 | Exceptional $102,962 |
| Cypriots | 100.0 /100 | #18 | Exceptional $102,843 |
| Immigrants | Australia | 100.0 /100 | #19 | Exceptional $102,562 |
| Bolivians | 100.0 /100 | #20 | Exceptional $102,195 |
| Eastern Europeans | 100.0 /100 | #21 | Exceptional $101,781 |
| Asians | 100.0 /100 | #22 | Exceptional $101,681 |
| Immigrants | Bolivia | 100.0 /100 | #23 | Exceptional $101,394 |
| Immigrants | Japan | 100.0 /100 | #24 | Exceptional $100,711 |
| Immigrants | Sweden | 100.0 /100 | #25 | Exceptional $100,699 |
| Immigrants | Belgium | 100.0 /100 | #26 | Exceptional $100,306 |
| Bhutanese | 100.0 /100 | #27 | Exceptional $100,151 |