Immigrants from Western Africa vs Aleut Median Female Earnings
COMPARE
Immigrants from Western Africa
Aleut
Median Female Earnings
Median Female Earnings Comparison
Immigrants from Western Africa
Aleuts
$39,351
MEDIAN FEMALE EARNINGS
32.7/ 100
METRIC RATING
191st/ 347
METRIC RANK
$38,719
MEDIAN FEMALE EARNINGS
11.6/ 100
METRIC RATING
211th/ 347
METRIC RANK
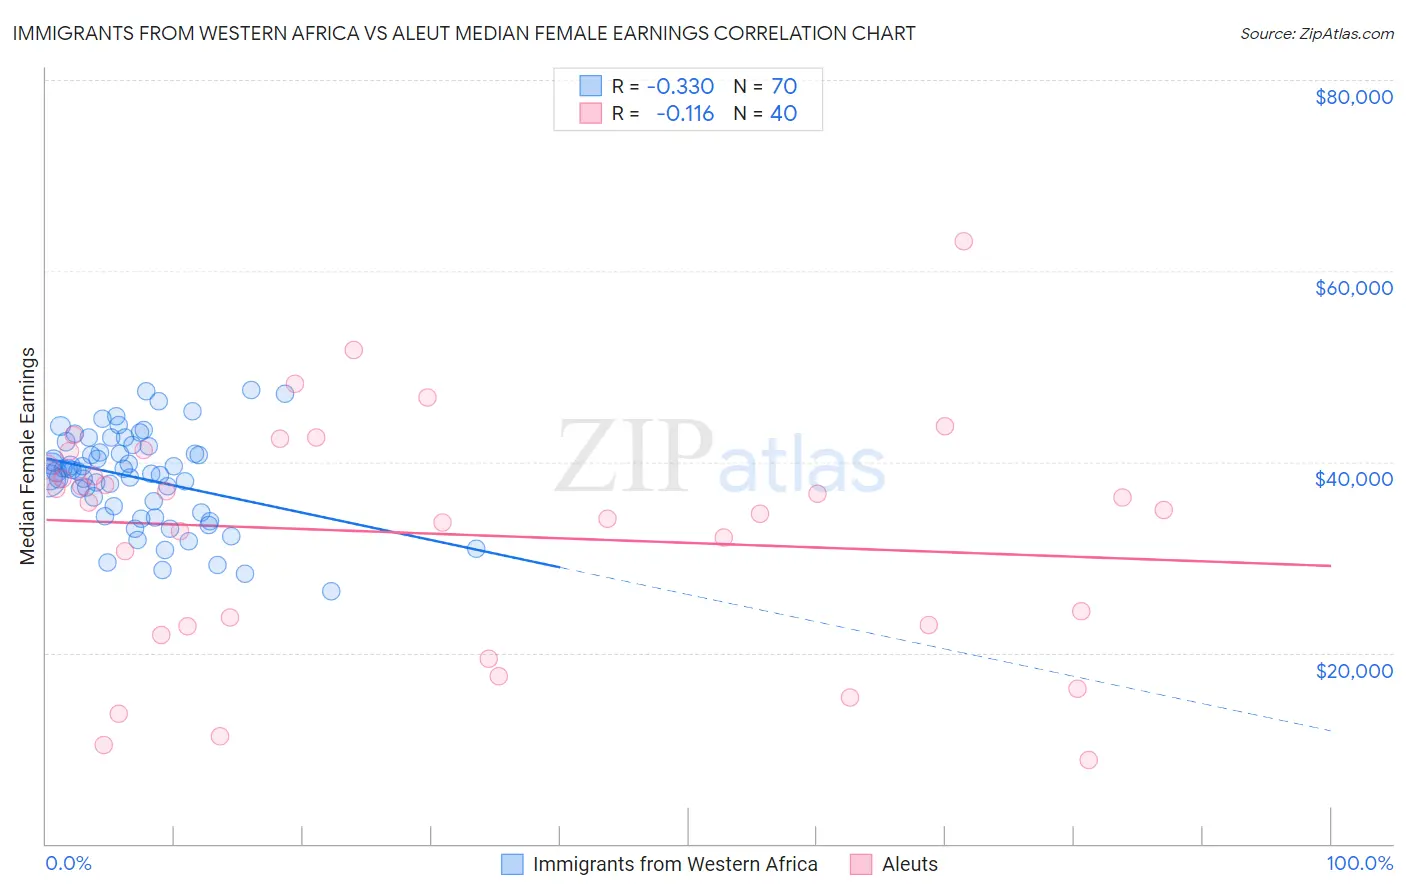
Immigrants from Western Africa vs Aleut Median Female Earnings Correlation Chart
The statistical analysis conducted on geographies consisting of 357,790,010 people shows a mild negative correlation between the proportion of Immigrants from Western Africa and median female earnings in the United States with a correlation coefficient (R) of -0.330 and weighted average of $39,351. Similarly, the statistical analysis conducted on geographies consisting of 61,761,178 people shows a poor negative correlation between the proportion of Aleuts and median female earnings in the United States with a correlation coefficient (R) of -0.116 and weighted average of $38,719, a difference of 1.6%.
Median Female Earnings Correlation Summary
| Measurement | Immigrants from Western Africa | Aleut |
| Minimum | $26,446 | $8,750 |
| Maximum | $47,567 | $63,125 |
| Range | $21,121 | $54,375 |
| Mean | $38,325 | $32,459 |
| Median | $39,007 | $35,345 |
| Interquartile 25% (IQ1) | $34,756 | $22,835 |
| Interquartile 75% (IQ3) | $41,620 | $40,258 |
| Interquartile Range (IQR) | $6,864 | $17,423 |
| Standard Deviation (Sample) | $4,866 | $12,271 |
| Standard Deviation (Population) | $4,831 | $12,117 |
Demographics Similar to Immigrants from Western Africa and Aleuts by Median Female Earnings
In terms of median female earnings, the demographic groups most similar to Immigrants from Western Africa are Immigrants ($39,328, a difference of 0.060%), Immigrants from Nigeria ($39,294, a difference of 0.14%), Irish ($39,291, a difference of 0.15%), Uruguayan ($39,228, a difference of 0.31%), and Immigrants from Costa Rica ($39,186, a difference of 0.42%). Similarly, the demographic groups most similar to Aleuts are Czechoslovakian ($38,738, a difference of 0.050%), Norwegian ($38,802, a difference of 0.21%), Immigrants from Thailand ($38,810, a difference of 0.23%), Immigrants from Cambodia ($38,833, a difference of 0.29%), and Immigrants from Bosnia and Herzegovina ($38,886, a difference of 0.43%).
| Demographics | Rating | Rank | Median Female Earnings |
| Immigrants | Western Africa | 32.7 /100 | #191 | Fair $39,351 |
| Immigrants | Immigrants | 31.7 /100 | #192 | Fair $39,328 |
| Immigrants | Nigeria | 30.2 /100 | #193 | Fair $39,294 |
| Irish | 30.0 /100 | #194 | Fair $39,291 |
| Uruguayans | 27.3 /100 | #195 | Fair $39,228 |
| Immigrants | Costa Rica | 25.6 /100 | #196 | Fair $39,186 |
| Assyrians/Chaldeans/Syriacs | 24.6 /100 | #197 | Fair $39,159 |
| Ecuadorians | 23.0 /100 | #198 | Fair $39,117 |
| Icelanders | 22.7 /100 | #199 | Fair $39,109 |
| Immigrants | Panama | 20.6 /100 | #200 | Fair $39,049 |
| Panamanians | 20.6 /100 | #201 | Fair $39,049 |
| Slovaks | 19.9 /100 | #202 | Poor $39,029 |
| Czechs | 18.7 /100 | #203 | Poor $38,992 |
| Immigrants | Uruguay | 17.3 /100 | #204 | Poor $38,945 |
| Immigrants | Colombia | 16.3 /100 | #205 | Poor $38,913 |
| Immigrants | Bosnia and Herzegovina | 15.6 /100 | #206 | Poor $38,886 |
| Immigrants | Cambodia | 14.2 /100 | #207 | Poor $38,833 |
| Immigrants | Thailand | 13.6 /100 | #208 | Poor $38,810 |
| Norwegians | 13.4 /100 | #209 | Poor $38,802 |
| Czechoslovakians | 12.0 /100 | #210 | Poor $38,738 |
| Aleuts | 11.6 /100 | #211 | Poor $38,719 |