Lumbee vs Aleut Median Female Earnings
COMPARE
Lumbee
Aleut
Median Female Earnings
Median Female Earnings Comparison
Lumbee
Aleuts
$32,500
MEDIAN FEMALE EARNINGS
0.0/ 100
METRIC RATING
344th/ 347
METRIC RANK
$38,719
MEDIAN FEMALE EARNINGS
11.6/ 100
METRIC RATING
211th/ 347
METRIC RANK
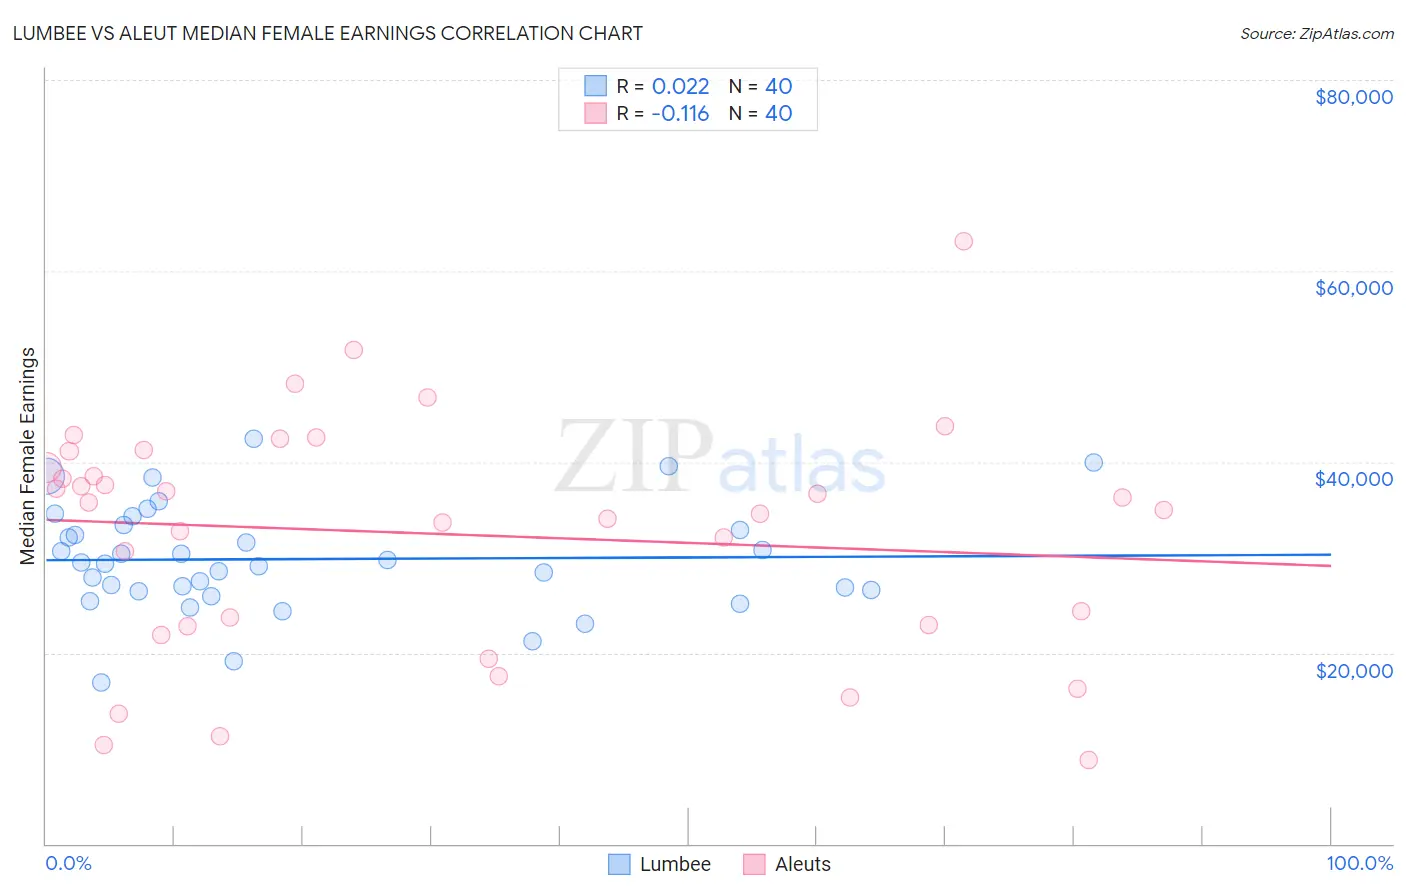
Lumbee vs Aleut Median Female Earnings Correlation Chart
The statistical analysis conducted on geographies consisting of 92,259,660 people shows no correlation between the proportion of Lumbee and median female earnings in the United States with a correlation coefficient (R) of 0.022 and weighted average of $32,500. Similarly, the statistical analysis conducted on geographies consisting of 61,761,178 people shows a poor negative correlation between the proportion of Aleuts and median female earnings in the United States with a correlation coefficient (R) of -0.116 and weighted average of $38,719, a difference of 19.1%.
Median Female Earnings Correlation Summary
| Measurement | Lumbee | Aleut |
| Minimum | $16,874 | $8,750 |
| Maximum | $42,434 | $63,125 |
| Range | $25,560 | $54,375 |
| Mean | $29,823 | $32,459 |
| Median | $29,442 | $35,345 |
| Interquartile 25% (IQ1) | $26,496 | $22,835 |
| Interquartile 75% (IQ3) | $33,125 | $40,258 |
| Interquartile Range (IQR) | $6,629 | $17,423 |
| Standard Deviation (Sample) | $5,605 | $12,271 |
| Standard Deviation (Population) | $5,534 | $12,117 |
Similar Demographics by Median Female Earnings
Demographics Similar to Lumbee by Median Female Earnings
In terms of median female earnings, the demographic groups most similar to Lumbee are Pueblo ($32,564, a difference of 0.20%), Yup'ik ($32,730, a difference of 0.71%), Navajo ($33,046, a difference of 1.7%), Tohono O'odham ($33,205, a difference of 2.2%), and Immigrants from Mexico ($33,236, a difference of 2.3%).
| Demographics | Rating | Rank | Median Female Earnings |
| Mexicans | 0.0 /100 | #333 | Tragic $33,664 |
| Spanish American Indians | 0.0 /100 | #334 | Tragic $33,625 |
| Creek | 0.0 /100 | #335 | Tragic $33,437 |
| Ottawa | 0.0 /100 | #336 | Tragic $33,378 |
| Yakama | 0.0 /100 | #337 | Tragic $33,354 |
| Immigrants | Cuba | 0.0 /100 | #338 | Tragic $33,291 |
| Immigrants | Mexico | 0.0 /100 | #339 | Tragic $33,236 |
| Tohono O'odham | 0.0 /100 | #340 | Tragic $33,205 |
| Navajo | 0.0 /100 | #341 | Tragic $33,046 |
| Yup'ik | 0.0 /100 | #342 | Tragic $32,730 |
| Pueblo | 0.0 /100 | #343 | Tragic $32,564 |
| Lumbee | 0.0 /100 | #344 | Tragic $32,500 |
| Puerto Ricans | 0.0 /100 | #345 | Tragic $31,560 |
| Arapaho | 0.0 /100 | #346 | Tragic $31,489 |
| Houma | 0.0 /100 | #347 | Tragic $30,343 |
Demographics Similar to Aleuts by Median Female Earnings
In terms of median female earnings, the demographic groups most similar to Aleuts are Guamanian/Chamorro ($38,717, a difference of 0.010%), Czechoslovakian ($38,738, a difference of 0.050%), Jamaican ($38,670, a difference of 0.13%), Iraqi ($38,666, a difference of 0.14%), and Spaniard ($38,656, a difference of 0.16%).
| Demographics | Rating | Rank | Median Female Earnings |
| Immigrants | Uruguay | 17.3 /100 | #204 | Poor $38,945 |
| Immigrants | Colombia | 16.3 /100 | #205 | Poor $38,913 |
| Immigrants | Bosnia and Herzegovina | 15.6 /100 | #206 | Poor $38,886 |
| Immigrants | Cambodia | 14.2 /100 | #207 | Poor $38,833 |
| Immigrants | Thailand | 13.6 /100 | #208 | Poor $38,810 |
| Norwegians | 13.4 /100 | #209 | Poor $38,802 |
| Czechoslovakians | 12.0 /100 | #210 | Poor $38,738 |
| Aleuts | 11.6 /100 | #211 | Poor $38,719 |
| Guamanians/Chamorros | 11.5 /100 | #212 | Poor $38,717 |
| Jamaicans | 10.5 /100 | #213 | Poor $38,670 |
| Iraqis | 10.5 /100 | #214 | Poor $38,666 |
| Spaniards | 10.3 /100 | #215 | Poor $38,656 |
| Immigrants | Ecuador | 10.1 /100 | #216 | Poor $38,644 |
| Immigrants | Jamaica | 9.7 /100 | #217 | Tragic $38,625 |
| Cape Verdeans | 9.5 /100 | #218 | Tragic $38,614 |