Welsh vs Inupiat Median Male Earnings
COMPARE
Welsh
Inupiat
Median Male Earnings
Median Male Earnings Comparison
Welsh
Inupiat
$54,647
MEDIAN MALE EARNINGS
53.8/ 100
METRIC RATING
172nd/ 347
METRIC RANK
$47,281
MEDIAN MALE EARNINGS
0.1/ 100
METRIC RATING
296th/ 347
METRIC RANK
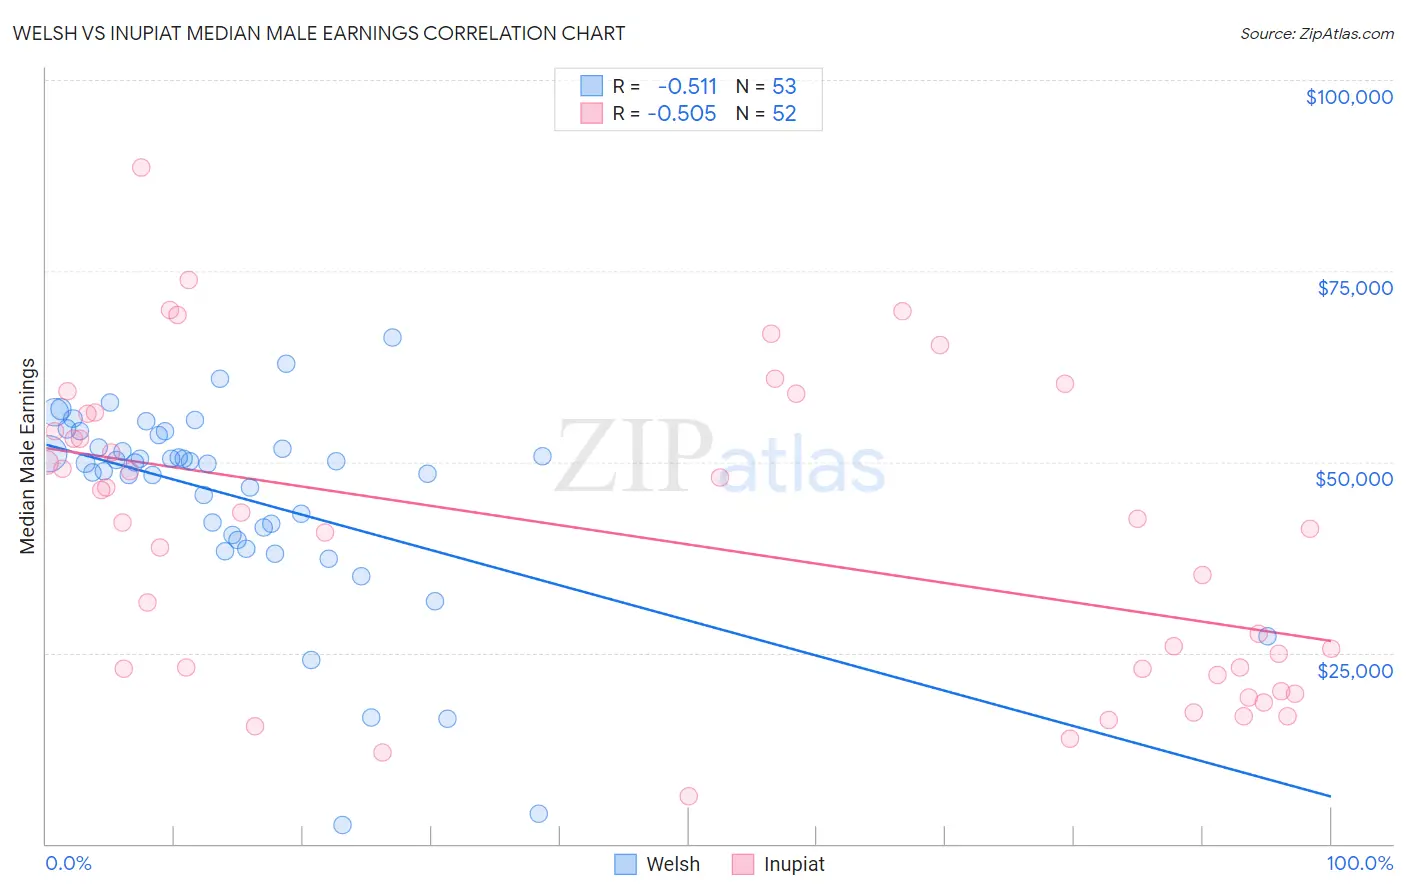
Welsh vs Inupiat Median Male Earnings Correlation Chart
The statistical analysis conducted on geographies consisting of 527,949,095 people shows a substantial negative correlation between the proportion of Welsh and median male earnings in the United States with a correlation coefficient (R) of -0.511 and weighted average of $54,647. Similarly, the statistical analysis conducted on geographies consisting of 96,323,006 people shows a substantial negative correlation between the proportion of Inupiat and median male earnings in the United States with a correlation coefficient (R) of -0.505 and weighted average of $47,281, a difference of 15.6%.
Median Male Earnings Correlation Summary
| Measurement | Welsh | Inupiat |
| Minimum | $2,499 | $6,250 |
| Maximum | $66,364 | $88,594 |
| Range | $63,865 | $82,344 |
| Mean | $45,194 | $40,024 |
| Median | $49,839 | $41,688 |
| Interquartile 25% (IQ1) | $40,118 | $22,499 |
| Interquartile 75% (IQ3) | $52,741 | $55,179 |
| Interquartile Range (IQR) | $12,623 | $32,680 |
| Standard Deviation (Sample) | $13,217 | $19,878 |
| Standard Deviation (Population) | $13,092 | $19,686 |
Similar Demographics by Median Male Earnings
Demographics Similar to Welsh by Median Male Earnings
In terms of median male earnings, the demographic groups most similar to Welsh are Immigrants from Peru ($54,695, a difference of 0.090%), French Canadian ($54,722, a difference of 0.14%), Finnish ($54,721, a difference of 0.14%), South American Indian ($54,508, a difference of 0.25%), and South American ($54,492, a difference of 0.28%).
| Demographics | Rating | Rank | Median Male Earnings |
| Immigrants | Portugal | 66.3 /100 | #165 | Good $55,182 |
| Germans | 61.6 /100 | #166 | Good $54,974 |
| Immigrants | Fiji | 61.2 /100 | #167 | Good $54,958 |
| Immigrants | Vietnam | 60.2 /100 | #168 | Good $54,913 |
| French Canadians | 55.6 /100 | #169 | Average $54,722 |
| Finns | 55.6 /100 | #170 | Average $54,721 |
| Immigrants | Peru | 54.9 /100 | #171 | Average $54,695 |
| Welsh | 53.8 /100 | #172 | Average $54,647 |
| South American Indians | 50.4 /100 | #173 | Average $54,508 |
| South Americans | 50.0 /100 | #174 | Average $54,492 |
| Dutch | 48.0 /100 | #175 | Average $54,410 |
| Spaniards | 47.8 /100 | #176 | Average $54,401 |
| Costa Ricans | 44.8 /100 | #177 | Average $54,279 |
| Sierra Leoneans | 44.8 /100 | #178 | Average $54,279 |
| Celtics | 43.9 /100 | #179 | Average $54,242 |
Demographics Similar to Inupiat by Median Male Earnings
In terms of median male earnings, the demographic groups most similar to Inupiat are Dominican ($47,204, a difference of 0.16%), Immigrants from Micronesia ($47,177, a difference of 0.22%), Central American Indian ($47,433, a difference of 0.32%), Immigrants from Nicaragua ($47,482, a difference of 0.43%), and Immigrants from Zaire ($47,070, a difference of 0.45%).
| Demographics | Rating | Rank | Median Male Earnings |
| Chickasaw | 0.1 /100 | #289 | Tragic $47,832 |
| Immigrants | Belize | 0.1 /100 | #290 | Tragic $47,809 |
| Choctaw | 0.1 /100 | #291 | Tragic $47,729 |
| Immigrants | Dominica | 0.1 /100 | #292 | Tragic $47,651 |
| Indonesians | 0.1 /100 | #293 | Tragic $47,503 |
| Immigrants | Nicaragua | 0.1 /100 | #294 | Tragic $47,482 |
| Central American Indians | 0.1 /100 | #295 | Tragic $47,433 |
| Inupiat | 0.1 /100 | #296 | Tragic $47,281 |
| Dominicans | 0.1 /100 | #297 | Tragic $47,204 |
| Immigrants | Micronesia | 0.1 /100 | #298 | Tragic $47,177 |
| Immigrants | Zaire | 0.1 /100 | #299 | Tragic $47,070 |
| U.S. Virgin Islanders | 0.1 /100 | #300 | Tragic $47,066 |
| Immigrants | Latin America | 0.1 /100 | #301 | Tragic $46,941 |
| Seminole | 0.1 /100 | #302 | Tragic $46,783 |
| Yaqui | 0.1 /100 | #303 | Tragic $46,777 |