Welsh vs Immigrants from Nicaragua Median Earnings
COMPARE
Welsh
Immigrants from Nicaragua
Median Earnings
Median Earnings Comparison
Welsh
Immigrants from Nicaragua
$45,710
MEDIAN EARNINGS
26.6/ 100
METRIC RATING
203rd/ 347
METRIC RANK
$41,737
MEDIAN EARNINGS
0.1/ 100
METRIC RATING
285th/ 347
METRIC RANK
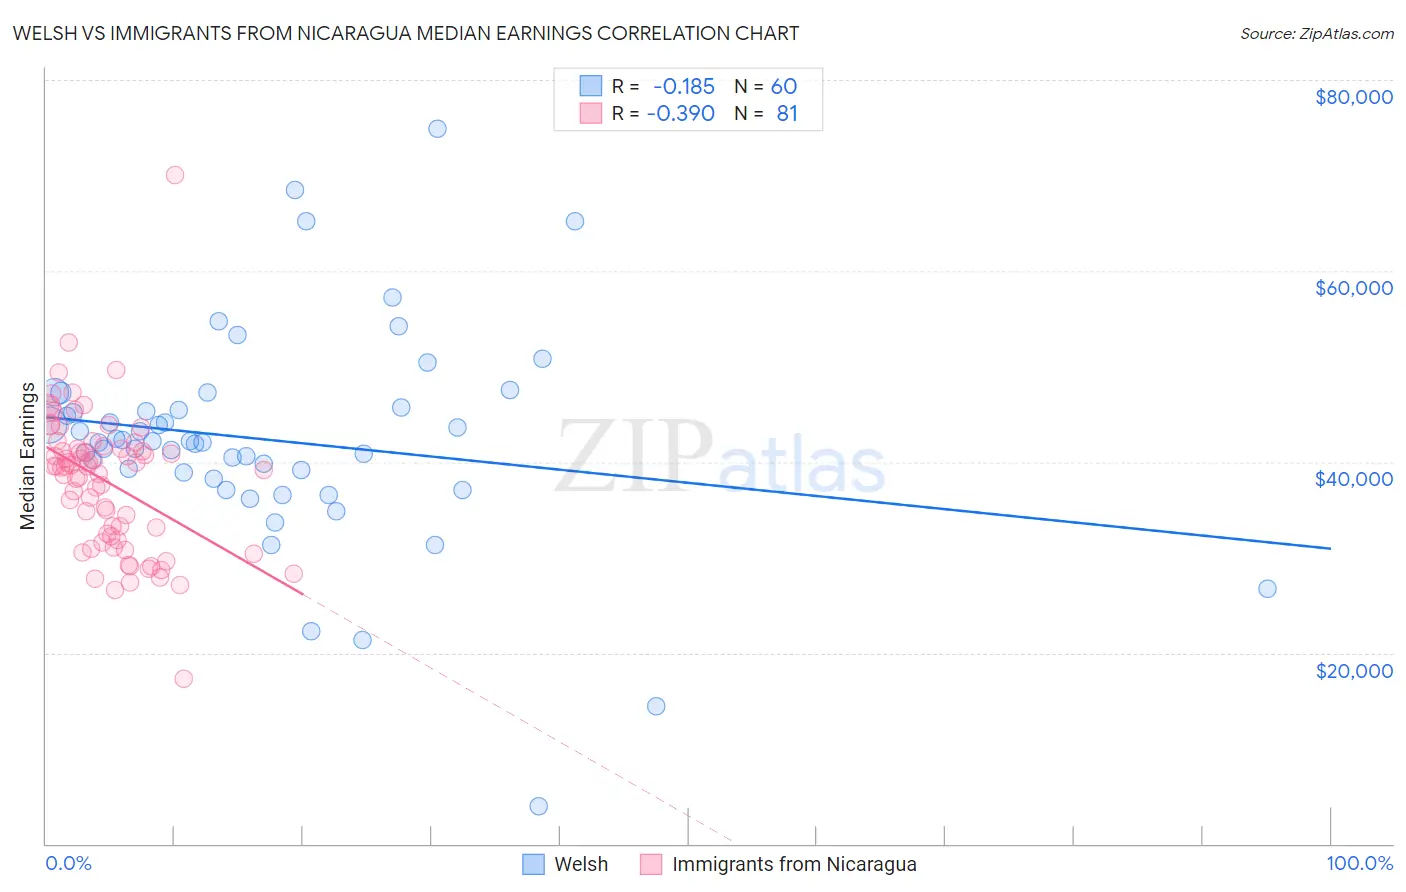
Welsh vs Immigrants from Nicaragua Median Earnings Correlation Chart
The statistical analysis conducted on geographies consisting of 528,402,039 people shows a poor negative correlation between the proportion of Welsh and median earnings in the United States with a correlation coefficient (R) of -0.185 and weighted average of $45,710. Similarly, the statistical analysis conducted on geographies consisting of 236,337,785 people shows a mild negative correlation between the proportion of Immigrants from Nicaragua and median earnings in the United States with a correlation coefficient (R) of -0.390 and weighted average of $41,737, a difference of 9.5%.
Median Earnings Correlation Summary
| Measurement | Welsh | Immigrants from Nicaragua |
| Minimum | $3,902 | $17,262 |
| Maximum | $74,844 | $70,084 |
| Range | $70,942 | $52,822 |
| Mean | $42,284 | $37,945 |
| Median | $42,106 | $39,498 |
| Interquartile 25% (IQ1) | $38,560 | $31,989 |
| Interquartile 75% (IQ3) | $45,605 | $41,525 |
| Interquartile Range (IQR) | $7,045 | $9,536 |
| Standard Deviation (Sample) | $11,412 | $7,439 |
| Standard Deviation (Population) | $11,316 | $7,393 |
Similar Demographics by Median Earnings
Demographics Similar to Welsh by Median Earnings
In terms of median earnings, the demographic groups most similar to Welsh are Immigrants from Trinidad and Tobago ($45,729, a difference of 0.040%), Celtic ($45,732, a difference of 0.050%), Immigrants from Uruguay ($45,682, a difference of 0.060%), Tongan ($45,665, a difference of 0.10%), and Immigrants from Ghana ($45,641, a difference of 0.15%).
| Demographics | Rating | Rank | Median Earnings |
| Yugoslavians | 30.5 /100 | #196 | Fair $45,846 |
| Barbadians | 30.5 /100 | #197 | Fair $45,846 |
| Trinidadians and Tobagonians | 29.7 /100 | #198 | Fair $45,820 |
| Immigrants | Barbados | 29.6 /100 | #199 | Fair $45,816 |
| Immigrants | Azores | 29.5 /100 | #200 | Fair $45,812 |
| Celtics | 27.2 /100 | #201 | Fair $45,732 |
| Immigrants | Trinidad and Tobago | 27.1 /100 | #202 | Fair $45,729 |
| Welsh | 26.6 /100 | #203 | Fair $45,710 |
| Immigrants | Uruguay | 25.9 /100 | #204 | Fair $45,682 |
| Tongans | 25.4 /100 | #205 | Fair $45,665 |
| Immigrants | Ghana | 24.8 /100 | #206 | Fair $45,641 |
| Immigrants | Senegal | 24.0 /100 | #207 | Fair $45,611 |
| Immigrants | Bosnia and Herzegovina | 23.7 /100 | #208 | Fair $45,600 |
| Immigrants | Thailand | 23.7 /100 | #209 | Fair $45,598 |
| Immigrants | Grenada | 23.6 /100 | #210 | Fair $45,596 |
Demographics Similar to Immigrants from Nicaragua by Median Earnings
In terms of median earnings, the demographic groups most similar to Immigrants from Nicaragua are Mexican American Indian ($41,719, a difference of 0.040%), Indonesian ($41,701, a difference of 0.090%), Blackfeet ($41,822, a difference of 0.20%), Dominican ($41,864, a difference of 0.31%), and Immigrants from Dominican Republic ($41,554, a difference of 0.44%).
| Demographics | Rating | Rank | Median Earnings |
| Cajuns | 0.3 /100 | #278 | Tragic $42,189 |
| Colville | 0.2 /100 | #279 | Tragic $42,151 |
| Hmong | 0.2 /100 | #280 | Tragic $42,111 |
| Marshallese | 0.2 /100 | #281 | Tragic $41,969 |
| Africans | 0.2 /100 | #282 | Tragic $41,955 |
| Dominicans | 0.2 /100 | #283 | Tragic $41,864 |
| Blackfeet | 0.2 /100 | #284 | Tragic $41,822 |
| Immigrants | Nicaragua | 0.1 /100 | #285 | Tragic $41,737 |
| Mexican American Indians | 0.1 /100 | #286 | Tragic $41,719 |
| Indonesians | 0.1 /100 | #287 | Tragic $41,701 |
| Immigrants | Dominican Republic | 0.1 /100 | #288 | Tragic $41,554 |
| Comanche | 0.1 /100 | #289 | Tragic $41,519 |
| Paiute | 0.1 /100 | #290 | Tragic $41,508 |
| Central American Indians | 0.1 /100 | #291 | Tragic $41,474 |
| U.S. Virgin Islanders | 0.1 /100 | #292 | Tragic $41,448 |