Welsh vs Immigrants from the Azores Median Earnings
COMPARE
Welsh
Immigrants from the Azores
Median Earnings
Median Earnings Comparison
Welsh
Immigrants from the Azores
$45,710
MEDIAN EARNINGS
26.6/ 100
METRIC RATING
203rd/ 347
METRIC RANK
$45,812
MEDIAN EARNINGS
29.5/ 100
METRIC RATING
200th/ 347
METRIC RANK
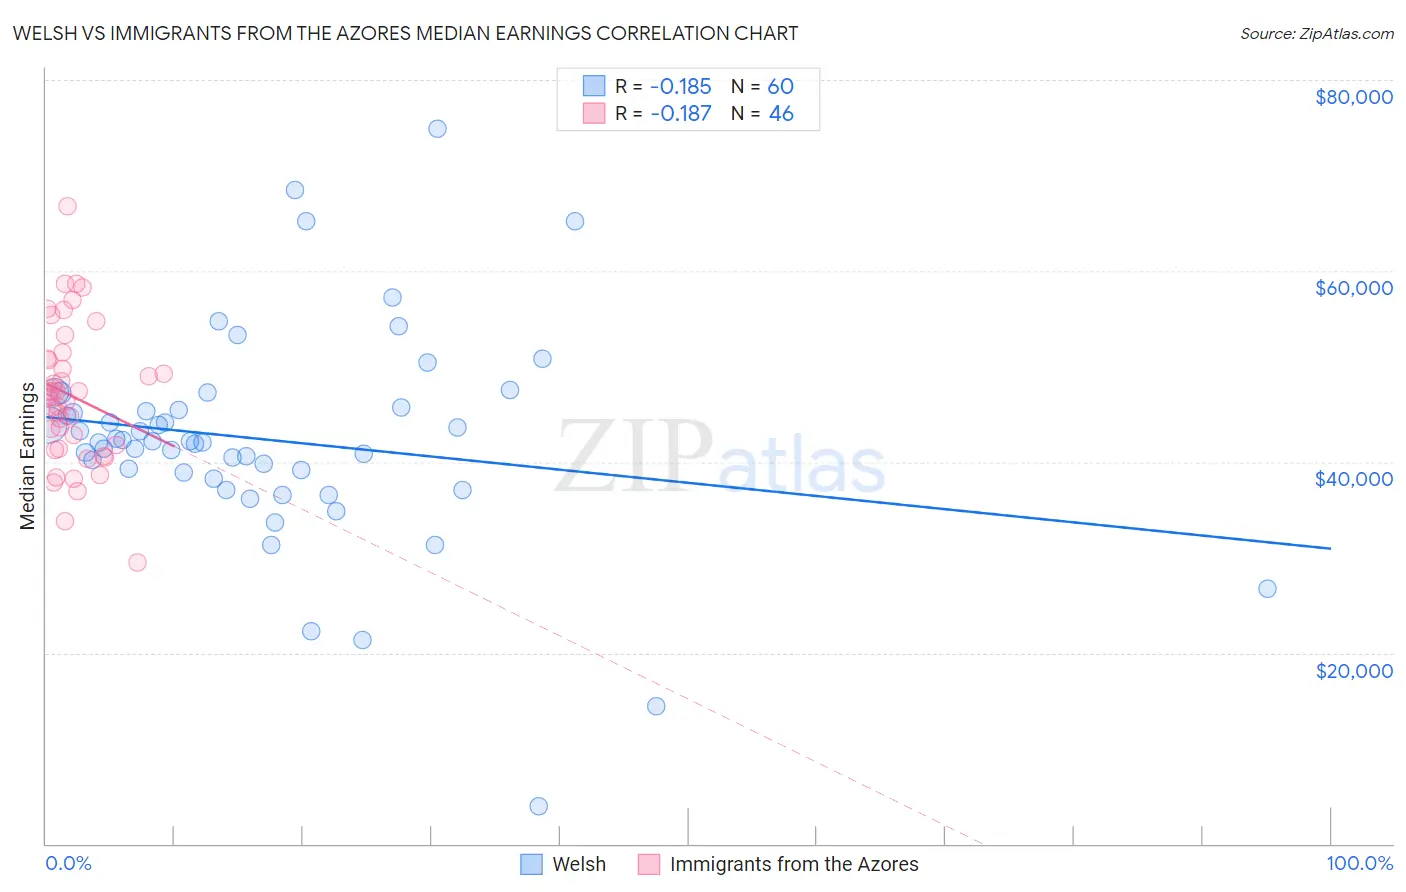
Welsh vs Immigrants from the Azores Median Earnings Correlation Chart
The statistical analysis conducted on geographies consisting of 528,402,039 people shows a poor negative correlation between the proportion of Welsh and median earnings in the United States with a correlation coefficient (R) of -0.185 and weighted average of $45,710. Similarly, the statistical analysis conducted on geographies consisting of 46,253,253 people shows a poor negative correlation between the proportion of Immigrants from the Azores and median earnings in the United States with a correlation coefficient (R) of -0.187 and weighted average of $45,812, a difference of 0.22%.
Median Earnings Correlation Summary
| Measurement | Welsh | Immigrants from the Azores |
| Minimum | $3,902 | $29,500 |
| Maximum | $74,844 | $66,731 |
| Range | $70,942 | $37,231 |
| Mean | $42,284 | $46,892 |
| Median | $42,106 | $46,853 |
| Interquartile 25% (IQ1) | $38,560 | $41,350 |
| Interquartile 75% (IQ3) | $45,605 | $50,852 |
| Interquartile Range (IQR) | $7,045 | $9,501 |
| Standard Deviation (Sample) | $11,412 | $7,383 |
| Standard Deviation (Population) | $11,316 | $7,302 |
Demographics Similar to Welsh and Immigrants from the Azores by Median Earnings
In terms of median earnings, the demographic groups most similar to Welsh are Immigrants from Trinidad and Tobago ($45,729, a difference of 0.040%), Celtic ($45,732, a difference of 0.050%), Immigrants from Uruguay ($45,682, a difference of 0.060%), Tongan ($45,665, a difference of 0.10%), and Immigrants from Ghana ($45,641, a difference of 0.15%). Similarly, the demographic groups most similar to Immigrants from the Azores are Immigrants from Barbados ($45,816, a difference of 0.010%), Trinidadian and Tobagonian ($45,820, a difference of 0.020%), Yugoslavian ($45,846, a difference of 0.070%), Barbadian ($45,846, a difference of 0.070%), and Celtic ($45,732, a difference of 0.18%).
| Demographics | Rating | Rank | Median Earnings |
| Finns | 33.4 /100 | #191 | Fair $45,940 |
| Germans | 33.2 /100 | #192 | Fair $45,935 |
| Guamanians/Chamorros | 33.2 /100 | #193 | Fair $45,933 |
| Immigrants | Costa Rica | 33.0 /100 | #194 | Fair $45,928 |
| Immigrants | St. Vincent and the Grenadines | 32.4 /100 | #195 | Fair $45,908 |
| Yugoslavians | 30.5 /100 | #196 | Fair $45,846 |
| Barbadians | 30.5 /100 | #197 | Fair $45,846 |
| Trinidadians and Tobagonians | 29.7 /100 | #198 | Fair $45,820 |
| Immigrants | Barbados | 29.6 /100 | #199 | Fair $45,816 |
| Immigrants | Azores | 29.5 /100 | #200 | Fair $45,812 |
| Celtics | 27.2 /100 | #201 | Fair $45,732 |
| Immigrants | Trinidad and Tobago | 27.1 /100 | #202 | Fair $45,729 |
| Welsh | 26.6 /100 | #203 | Fair $45,710 |
| Immigrants | Uruguay | 25.9 /100 | #204 | Fair $45,682 |
| Tongans | 25.4 /100 | #205 | Fair $45,665 |
| Immigrants | Ghana | 24.8 /100 | #206 | Fair $45,641 |
| Immigrants | Senegal | 24.0 /100 | #207 | Fair $45,611 |
| Immigrants | Bosnia and Herzegovina | 23.7 /100 | #208 | Fair $45,600 |
| Immigrants | Thailand | 23.7 /100 | #209 | Fair $45,598 |
| Immigrants | Grenada | 23.6 /100 | #210 | Fair $45,596 |
| Panamanians | 23.5 /100 | #211 | Fair $45,593 |