Immigrants from Asia vs Immigrants from Austria Median Earnings
COMPARE
Immigrants from Asia
Immigrants from Austria
Median Earnings
Median Earnings Comparison
Immigrants from Asia
Immigrants from Austria
$53,310
MEDIAN EARNINGS
100.0/ 100
METRIC RATING
32nd/ 347
METRIC RANK
$51,826
MEDIAN EARNINGS
99.9/ 100
METRIC RATING
51st/ 347
METRIC RANK
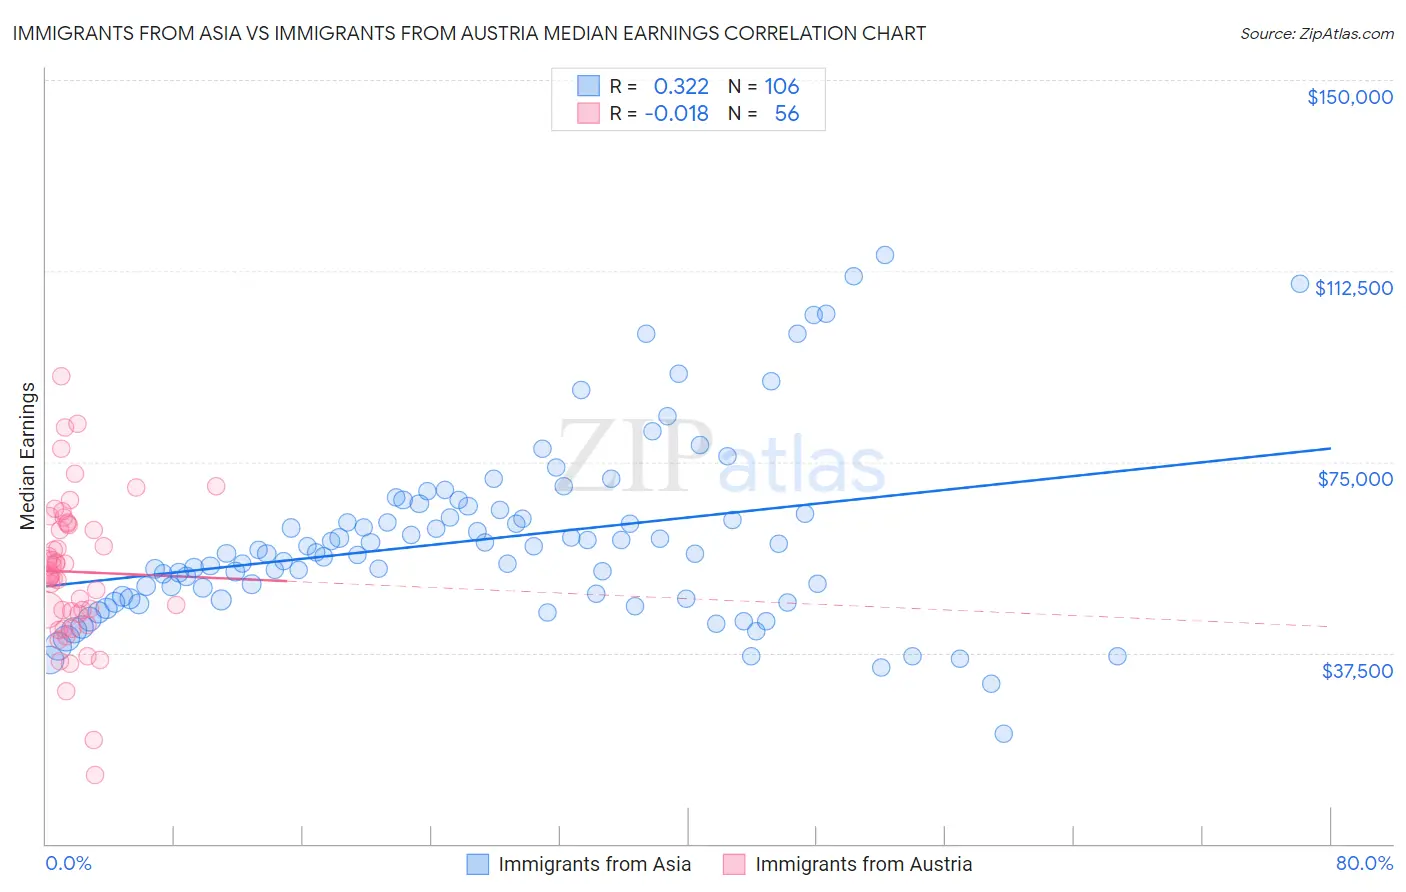
Immigrants from Asia vs Immigrants from Austria Median Earnings Correlation Chart
The statistical analysis conducted on geographies consisting of 549,053,293 people shows a mild positive correlation between the proportion of Immigrants from Asia and median earnings in the United States with a correlation coefficient (R) of 0.322 and weighted average of $53,310. Similarly, the statistical analysis conducted on geographies consisting of 167,962,840 people shows no correlation between the proportion of Immigrants from Austria and median earnings in the United States with a correlation coefficient (R) of -0.018 and weighted average of $51,826, a difference of 2.9%.
Median Earnings Correlation Summary
| Measurement | Immigrants from Asia | Immigrants from Austria |
| Minimum | $21,667 | $13,446 |
| Maximum | $115,585 | $91,775 |
| Range | $93,918 | $78,329 |
| Mean | $59,791 | $53,408 |
| Median | $57,103 | $52,944 |
| Interquartile 25% (IQ1) | $48,160 | $45,427 |
| Interquartile 75% (IQ3) | $65,665 | $62,672 |
| Interquartile Range (IQR) | $17,505 | $17,245 |
| Standard Deviation (Sample) | $17,673 | $14,505 |
| Standard Deviation (Population) | $17,589 | $14,375 |
Demographics Similar to Immigrants from Asia and Immigrants from Austria by Median Earnings
In terms of median earnings, the demographic groups most similar to Immigrants from Asia are Russian ($53,334, a difference of 0.040%), Immigrants from Greece ($53,282, a difference of 0.050%), Immigrants from Sri Lanka ($53,268, a difference of 0.080%), Immigrants from Switzerland ($53,211, a difference of 0.19%), and Immigrants from Denmark ($53,186, a difference of 0.23%). Similarly, the demographic groups most similar to Immigrants from Austria are Immigrants from South Africa ($51,850, a difference of 0.050%), Bolivian ($52,005, a difference of 0.35%), Immigrants from Europe ($52,195, a difference of 0.71%), Australian ($52,294, a difference of 0.90%), and Bhutanese ($52,297, a difference of 0.91%).
| Demographics | Rating | Rank | Median Earnings |
| Russians | 100.0 /100 | #31 | Exceptional $53,334 |
| Immigrants | Asia | 100.0 /100 | #32 | Exceptional $53,310 |
| Immigrants | Greece | 100.0 /100 | #33 | Exceptional $53,282 |
| Immigrants | Sri Lanka | 100.0 /100 | #34 | Exceptional $53,268 |
| Immigrants | Switzerland | 100.0 /100 | #35 | Exceptional $53,211 |
| Immigrants | Denmark | 100.0 /100 | #36 | Exceptional $53,186 |
| Immigrants | Belarus | 100.0 /100 | #37 | Exceptional $53,043 |
| Latvians | 100.0 /100 | #38 | Exceptional $53,001 |
| Immigrants | Turkey | 100.0 /100 | #39 | Exceptional $52,960 |
| Israelis | 100.0 /100 | #40 | Exceptional $52,937 |
| Immigrants | Lithuania | 100.0 /100 | #41 | Exceptional $52,769 |
| Maltese | 100.0 /100 | #42 | Exceptional $52,526 |
| Immigrants | Malaysia | 100.0 /100 | #43 | Exceptional $52,514 |
| Bulgarians | 100.0 /100 | #44 | Exceptional $52,512 |
| Immigrants | Czechoslovakia | 100.0 /100 | #45 | Exceptional $52,361 |
| Bhutanese | 100.0 /100 | #46 | Exceptional $52,297 |
| Australians | 100.0 /100 | #47 | Exceptional $52,294 |
| Immigrants | Europe | 100.0 /100 | #48 | Exceptional $52,195 |
| Bolivians | 100.0 /100 | #49 | Exceptional $52,005 |
| Immigrants | South Africa | 100.0 /100 | #50 | Exceptional $51,850 |
| Immigrants | Austria | 99.9 /100 | #51 | Exceptional $51,826 |