Welsh vs Immigrants from Asia Median Earnings
COMPARE
Welsh
Immigrants from Asia
Median Earnings
Median Earnings Comparison
Welsh
Immigrants from Asia
$45,710
MEDIAN EARNINGS
26.6/ 100
METRIC RATING
203rd/ 347
METRIC RANK
$53,310
MEDIAN EARNINGS
100.0/ 100
METRIC RATING
32nd/ 347
METRIC RANK
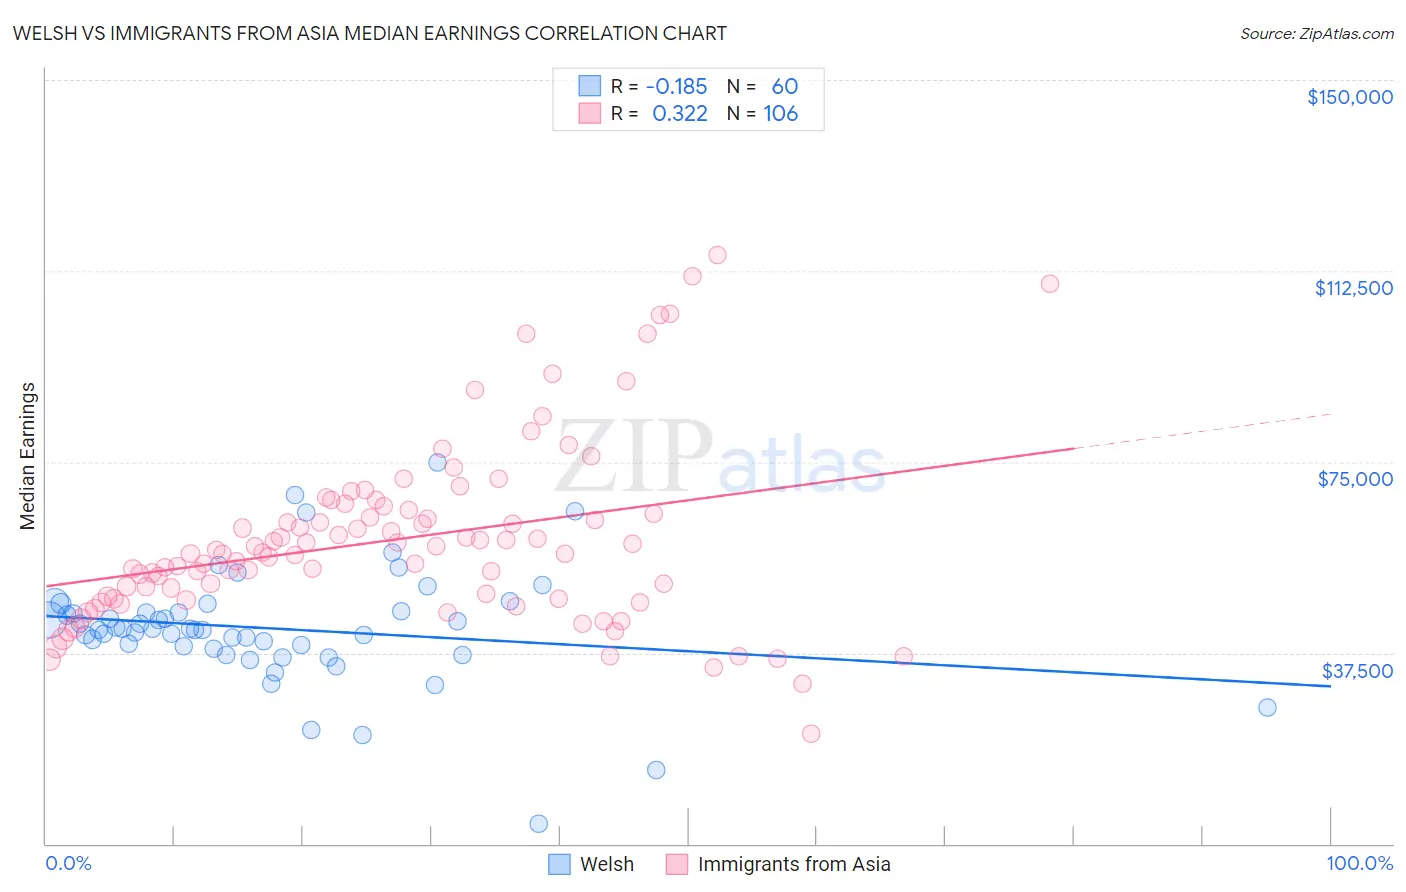
Welsh vs Immigrants from Asia Median Earnings Correlation Chart
The statistical analysis conducted on geographies consisting of 528,402,039 people shows a poor negative correlation between the proportion of Welsh and median earnings in the United States with a correlation coefficient (R) of -0.185 and weighted average of $45,710. Similarly, the statistical analysis conducted on geographies consisting of 549,053,293 people shows a mild positive correlation between the proportion of Immigrants from Asia and median earnings in the United States with a correlation coefficient (R) of 0.322 and weighted average of $53,310, a difference of 16.6%.
Median Earnings Correlation Summary
| Measurement | Welsh | Immigrants from Asia |
| Minimum | $3,902 | $21,667 |
| Maximum | $74,844 | $115,585 |
| Range | $70,942 | $93,918 |
| Mean | $42,284 | $59,791 |
| Median | $42,106 | $57,103 |
| Interquartile 25% (IQ1) | $38,560 | $48,160 |
| Interquartile 75% (IQ3) | $45,605 | $65,665 |
| Interquartile Range (IQR) | $7,045 | $17,505 |
| Standard Deviation (Sample) | $11,412 | $17,673 |
| Standard Deviation (Population) | $11,316 | $17,589 |
Similar Demographics by Median Earnings
Demographics Similar to Welsh by Median Earnings
In terms of median earnings, the demographic groups most similar to Welsh are Immigrants from Trinidad and Tobago ($45,729, a difference of 0.040%), Celtic ($45,732, a difference of 0.050%), Immigrants from Uruguay ($45,682, a difference of 0.060%), Tongan ($45,665, a difference of 0.10%), and Immigrants from Ghana ($45,641, a difference of 0.15%).
| Demographics | Rating | Rank | Median Earnings |
| Yugoslavians | 30.5 /100 | #196 | Fair $45,846 |
| Barbadians | 30.5 /100 | #197 | Fair $45,846 |
| Trinidadians and Tobagonians | 29.7 /100 | #198 | Fair $45,820 |
| Immigrants | Barbados | 29.6 /100 | #199 | Fair $45,816 |
| Immigrants | Azores | 29.5 /100 | #200 | Fair $45,812 |
| Celtics | 27.2 /100 | #201 | Fair $45,732 |
| Immigrants | Trinidad and Tobago | 27.1 /100 | #202 | Fair $45,729 |
| Welsh | 26.6 /100 | #203 | Fair $45,710 |
| Immigrants | Uruguay | 25.9 /100 | #204 | Fair $45,682 |
| Tongans | 25.4 /100 | #205 | Fair $45,665 |
| Immigrants | Ghana | 24.8 /100 | #206 | Fair $45,641 |
| Immigrants | Senegal | 24.0 /100 | #207 | Fair $45,611 |
| Immigrants | Bosnia and Herzegovina | 23.7 /100 | #208 | Fair $45,600 |
| Immigrants | Thailand | 23.7 /100 | #209 | Fair $45,598 |
| Immigrants | Grenada | 23.6 /100 | #210 | Fair $45,596 |
Demographics Similar to Immigrants from Asia by Median Earnings
In terms of median earnings, the demographic groups most similar to Immigrants from Asia are Russian ($53,334, a difference of 0.040%), Immigrants from Greece ($53,282, a difference of 0.050%), Immigrants from Sri Lanka ($53,268, a difference of 0.080%), Cambodian ($53,386, a difference of 0.14%), and Immigrants from Switzerland ($53,211, a difference of 0.19%).
| Demographics | Rating | Rank | Median Earnings |
| Turks | 100.0 /100 | #25 | Exceptional $53,919 |
| Immigrants | Northern Europe | 100.0 /100 | #26 | Exceptional $53,872 |
| Asians | 100.0 /100 | #27 | Exceptional $53,690 |
| Immigrants | France | 100.0 /100 | #28 | Exceptional $53,490 |
| Immigrants | Russia | 100.0 /100 | #29 | Exceptional $53,457 |
| Cambodians | 100.0 /100 | #30 | Exceptional $53,386 |
| Russians | 100.0 /100 | #31 | Exceptional $53,334 |
| Immigrants | Asia | 100.0 /100 | #32 | Exceptional $53,310 |
| Immigrants | Greece | 100.0 /100 | #33 | Exceptional $53,282 |
| Immigrants | Sri Lanka | 100.0 /100 | #34 | Exceptional $53,268 |
| Immigrants | Switzerland | 100.0 /100 | #35 | Exceptional $53,211 |
| Immigrants | Denmark | 100.0 /100 | #36 | Exceptional $53,186 |
| Immigrants | Belarus | 100.0 /100 | #37 | Exceptional $53,043 |
| Latvians | 100.0 /100 | #38 | Exceptional $53,001 |
| Immigrants | Turkey | 100.0 /100 | #39 | Exceptional $52,960 |