Finnish vs Immigrants from Austria Median Earnings
COMPARE
Finnish
Immigrants from Austria
Median Earnings
Median Earnings Comparison
Finns
Immigrants from Austria
$45,940
MEDIAN EARNINGS
33.4/ 100
METRIC RATING
191st/ 347
METRIC RANK
$51,826
MEDIAN EARNINGS
99.9/ 100
METRIC RATING
51st/ 347
METRIC RANK
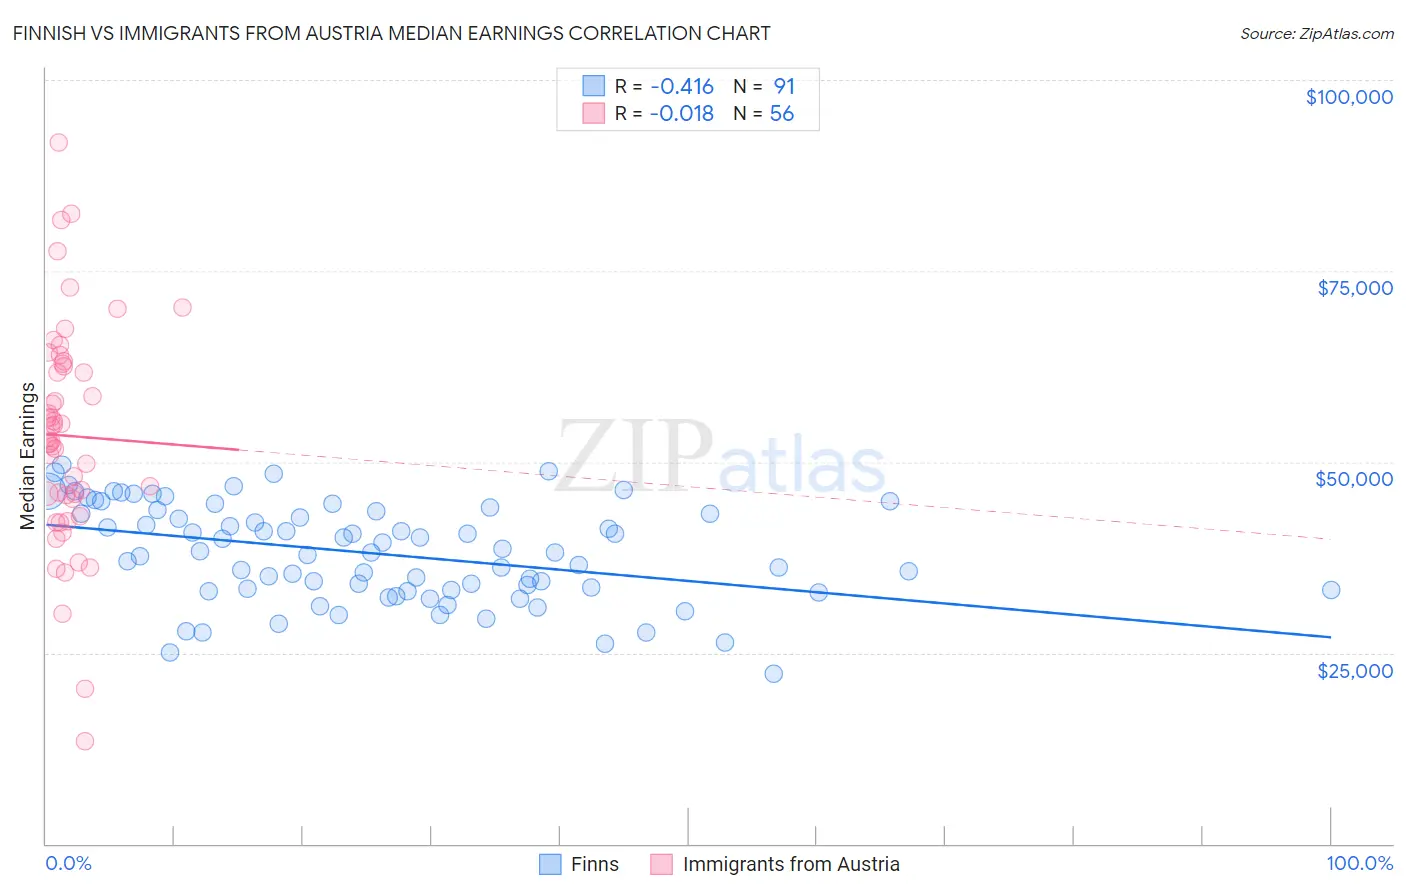
Finnish vs Immigrants from Austria Median Earnings Correlation Chart
The statistical analysis conducted on geographies consisting of 404,629,884 people shows a moderate negative correlation between the proportion of Finns and median earnings in the United States with a correlation coefficient (R) of -0.416 and weighted average of $45,940. Similarly, the statistical analysis conducted on geographies consisting of 167,962,840 people shows no correlation between the proportion of Immigrants from Austria and median earnings in the United States with a correlation coefficient (R) of -0.018 and weighted average of $51,826, a difference of 12.8%.
Median Earnings Correlation Summary
| Measurement | Finnish | Immigrants from Austria |
| Minimum | $22,232 | $13,446 |
| Maximum | $49,637 | $91,775 |
| Range | $27,405 | $78,329 |
| Mean | $38,029 | $53,408 |
| Median | $38,169 | $52,944 |
| Interquartile 25% (IQ1) | $33,167 | $45,427 |
| Interquartile 75% (IQ3) | $43,485 | $62,672 |
| Interquartile Range (IQR) | $10,318 | $17,245 |
| Standard Deviation (Sample) | $6,403 | $14,505 |
| Standard Deviation (Population) | $6,368 | $14,375 |
Similar Demographics by Median Earnings
Demographics Similar to Finns by Median Earnings
In terms of median earnings, the demographic groups most similar to Finns are German ($45,935, a difference of 0.010%), Guamanian/Chamorro ($45,933, a difference of 0.010%), Immigrants from Costa Rica ($45,928, a difference of 0.030%), Immigrants from St. Vincent and the Grenadines ($45,908, a difference of 0.070%), and French Canadian ($46,026, a difference of 0.19%).
| Demographics | Rating | Rank | Median Earnings |
| Immigrants | Kenya | 42.4 /100 | #184 | Average $46,214 |
| Uruguayans | 41.6 /100 | #185 | Average $46,190 |
| Vietnamese | 40.9 /100 | #186 | Average $46,172 |
| Iraqis | 39.9 /100 | #187 | Fair $46,140 |
| Immigrants | Armenia | 38.3 /100 | #188 | Fair $46,094 |
| Spaniards | 37.2 /100 | #189 | Fair $46,059 |
| French Canadians | 36.1 /100 | #190 | Fair $46,026 |
| Finns | 33.4 /100 | #191 | Fair $45,940 |
| Germans | 33.2 /100 | #192 | Fair $45,935 |
| Guamanians/Chamorros | 33.2 /100 | #193 | Fair $45,933 |
| Immigrants | Costa Rica | 33.0 /100 | #194 | Fair $45,928 |
| Immigrants | St. Vincent and the Grenadines | 32.4 /100 | #195 | Fair $45,908 |
| Yugoslavians | 30.5 /100 | #196 | Fair $45,846 |
| Barbadians | 30.5 /100 | #197 | Fair $45,846 |
| Trinidadians and Tobagonians | 29.7 /100 | #198 | Fair $45,820 |
Demographics Similar to Immigrants from Austria by Median Earnings
In terms of median earnings, the demographic groups most similar to Immigrants from Austria are Immigrants from South Africa ($51,850, a difference of 0.050%), Estonian ($51,772, a difference of 0.10%), Immigrants from Norway ($51,758, a difference of 0.13%), Immigrants from Indonesia ($51,715, a difference of 0.21%), and Egyptian ($51,701, a difference of 0.24%).
| Demographics | Rating | Rank | Median Earnings |
| Bulgarians | 100.0 /100 | #44 | Exceptional $52,512 |
| Immigrants | Czechoslovakia | 100.0 /100 | #45 | Exceptional $52,361 |
| Bhutanese | 100.0 /100 | #46 | Exceptional $52,297 |
| Australians | 100.0 /100 | #47 | Exceptional $52,294 |
| Immigrants | Europe | 100.0 /100 | #48 | Exceptional $52,195 |
| Bolivians | 100.0 /100 | #49 | Exceptional $52,005 |
| Immigrants | South Africa | 100.0 /100 | #50 | Exceptional $51,850 |
| Immigrants | Austria | 99.9 /100 | #51 | Exceptional $51,826 |
| Estonians | 99.9 /100 | #52 | Exceptional $51,772 |
| Immigrants | Norway | 99.9 /100 | #53 | Exceptional $51,758 |
| Immigrants | Indonesia | 99.9 /100 | #54 | Exceptional $51,715 |
| Egyptians | 99.9 /100 | #55 | Exceptional $51,701 |
| Immigrants | Pakistan | 99.9 /100 | #56 | Exceptional $51,693 |
| Immigrants | Eastern Europe | 99.9 /100 | #57 | Exceptional $51,624 |
| Immigrants | Bolivia | 99.9 /100 | #58 | Exceptional $51,605 |