Venezuelan vs Immigrants from Hungary Median Household Income
COMPARE
Venezuelan
Immigrants from Hungary
Median Household Income
Median Household Income Comparison
Venezuelans
Immigrants from Hungary
$82,432
MEDIAN HOUSEHOLD INCOME
15.3/ 100
METRIC RATING
212th/ 347
METRIC RANK
$92,094
MEDIAN HOUSEHOLD INCOME
98.9/ 100
METRIC RATING
87th/ 347
METRIC RANK
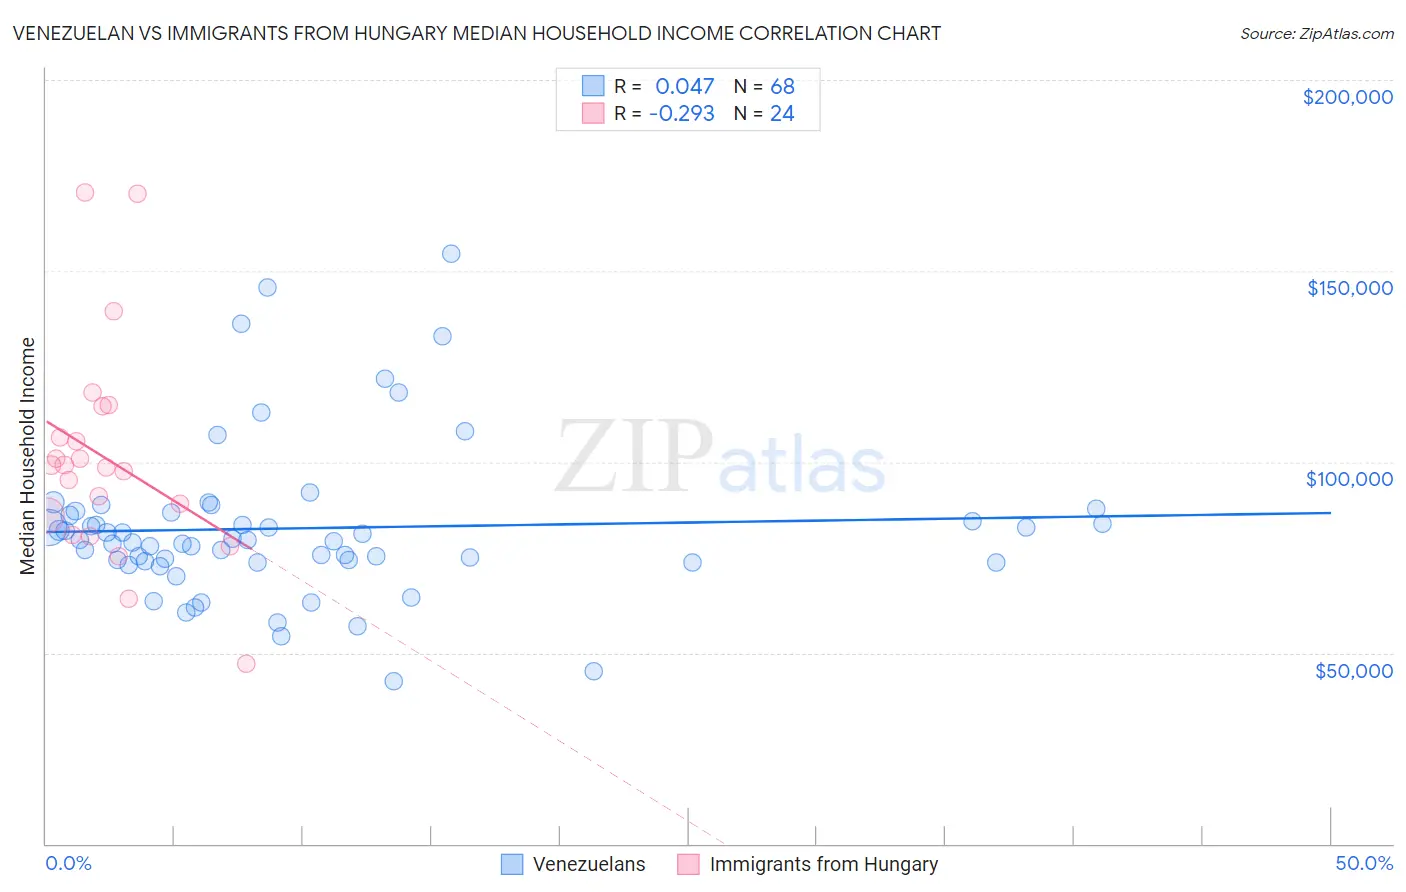
Venezuelan vs Immigrants from Hungary Median Household Income Correlation Chart
The statistical analysis conducted on geographies consisting of 306,067,078 people shows no correlation between the proportion of Venezuelans and median household income in the United States with a correlation coefficient (R) of 0.047 and weighted average of $82,432. Similarly, the statistical analysis conducted on geographies consisting of 195,647,875 people shows a weak negative correlation between the proportion of Immigrants from Hungary and median household income in the United States with a correlation coefficient (R) of -0.293 and weighted average of $92,094, a difference of 11.7%.
Median Household Income Correlation Summary
| Measurement | Venezuelan | Immigrants from Hungary |
| Minimum | $42,664 | $47,101 |
| Maximum | $154,652 | $170,520 |
| Range | $111,988 | $123,419 |
| Mean | $82,593 | $100,946 |
| Median | $79,442 | $98,883 |
| Interquartile 25% (IQ1) | $73,873 | $83,472 |
| Interquartile 75% (IQ3) | $86,330 | $110,497 |
| Interquartile Range (IQR) | $12,458 | $27,024 |
| Standard Deviation (Sample) | $20,652 | $28,457 |
| Standard Deviation (Population) | $20,500 | $27,858 |
Similar Demographics by Median Household Income
Demographics Similar to Venezuelans by Median Household Income
In terms of median household income, the demographic groups most similar to Venezuelans are Salvadoran ($82,449, a difference of 0.020%), Nepalese ($82,410, a difference of 0.030%), Immigrants from Uruguay ($82,560, a difference of 0.16%), Immigrants from Iraq ($82,594, a difference of 0.20%), and Panamanian ($82,272, a difference of 0.20%).
| Demographics | Rating | Rank | Median Household Income |
| Celtics | 22.7 /100 | #205 | Fair $83,193 |
| Immigrants | Kenya | 21.3 /100 | #206 | Fair $83,068 |
| Dutch | 20.3 /100 | #207 | Fair $82,971 |
| French Canadians | 18.7 /100 | #208 | Poor $82,810 |
| Immigrants | Iraq | 16.7 /100 | #209 | Poor $82,594 |
| Immigrants | Uruguay | 16.4 /100 | #210 | Poor $82,560 |
| Salvadorans | 15.4 /100 | #211 | Poor $82,449 |
| Venezuelans | 15.3 /100 | #212 | Poor $82,432 |
| Nepalese | 15.1 /100 | #213 | Poor $82,410 |
| Panamanians | 14.0 /100 | #214 | Poor $82,272 |
| Vietnamese | 13.8 /100 | #215 | Poor $82,248 |
| Yugoslavians | 13.3 /100 | #216 | Poor $82,186 |
| Ecuadorians | 12.5 /100 | #217 | Poor $82,070 |
| Whites/Caucasians | 12.2 /100 | #218 | Poor $82,029 |
| Nigerians | 10.3 /100 | #219 | Poor $81,725 |
Demographics Similar to Immigrants from Hungary by Median Household Income
In terms of median household income, the demographic groups most similar to Immigrants from Hungary are Immigrants from England ($92,098, a difference of 0.0%), Immigrants from Canada ($92,029, a difference of 0.070%), Romanian ($91,994, a difference of 0.11%), Assyrian/Chaldean/Syriac ($91,991, a difference of 0.11%), and Immigrants from Vietnam ($91,987, a difference of 0.12%).
| Demographics | Rating | Rank | Median Household Income |
| Tongans | 99.4 /100 | #80 | Exceptional $93,076 |
| Immigrants | Eastern Europe | 99.4 /100 | #81 | Exceptional $93,051 |
| Immigrants | Spain | 99.3 /100 | #82 | Exceptional $92,732 |
| Italians | 99.1 /100 | #83 | Exceptional $92,475 |
| Immigrants | Argentina | 99.1 /100 | #84 | Exceptional $92,417 |
| Immigrants | Croatia | 99.0 /100 | #85 | Exceptional $92,225 |
| Immigrants | England | 98.9 /100 | #86 | Exceptional $92,098 |
| Immigrants | Hungary | 98.9 /100 | #87 | Exceptional $92,094 |
| Immigrants | Canada | 98.8 /100 | #88 | Exceptional $92,029 |
| Romanians | 98.8 /100 | #89 | Exceptional $91,994 |
| Assyrians/Chaldeans/Syriacs | 98.8 /100 | #90 | Exceptional $91,991 |
| Immigrants | Vietnam | 98.8 /100 | #91 | Exceptional $91,987 |
| Immigrants | Western Europe | 98.8 /100 | #92 | Exceptional $91,936 |
| Immigrants | Lebanon | 98.7 /100 | #93 | Exceptional $91,887 |
| Immigrants | North America | 98.7 /100 | #94 | Exceptional $91,860 |