Venezuelan vs Seminole Median Household Income
COMPARE
Venezuelan
Seminole
Median Household Income
Median Household Income Comparison
Venezuelans
Seminole
$82,432
MEDIAN HOUSEHOLD INCOME
15.3/ 100
METRIC RATING
212th/ 347
METRIC RANK
$69,420
MEDIAN HOUSEHOLD INCOME
0.0/ 100
METRIC RATING
325th/ 347
METRIC RANK
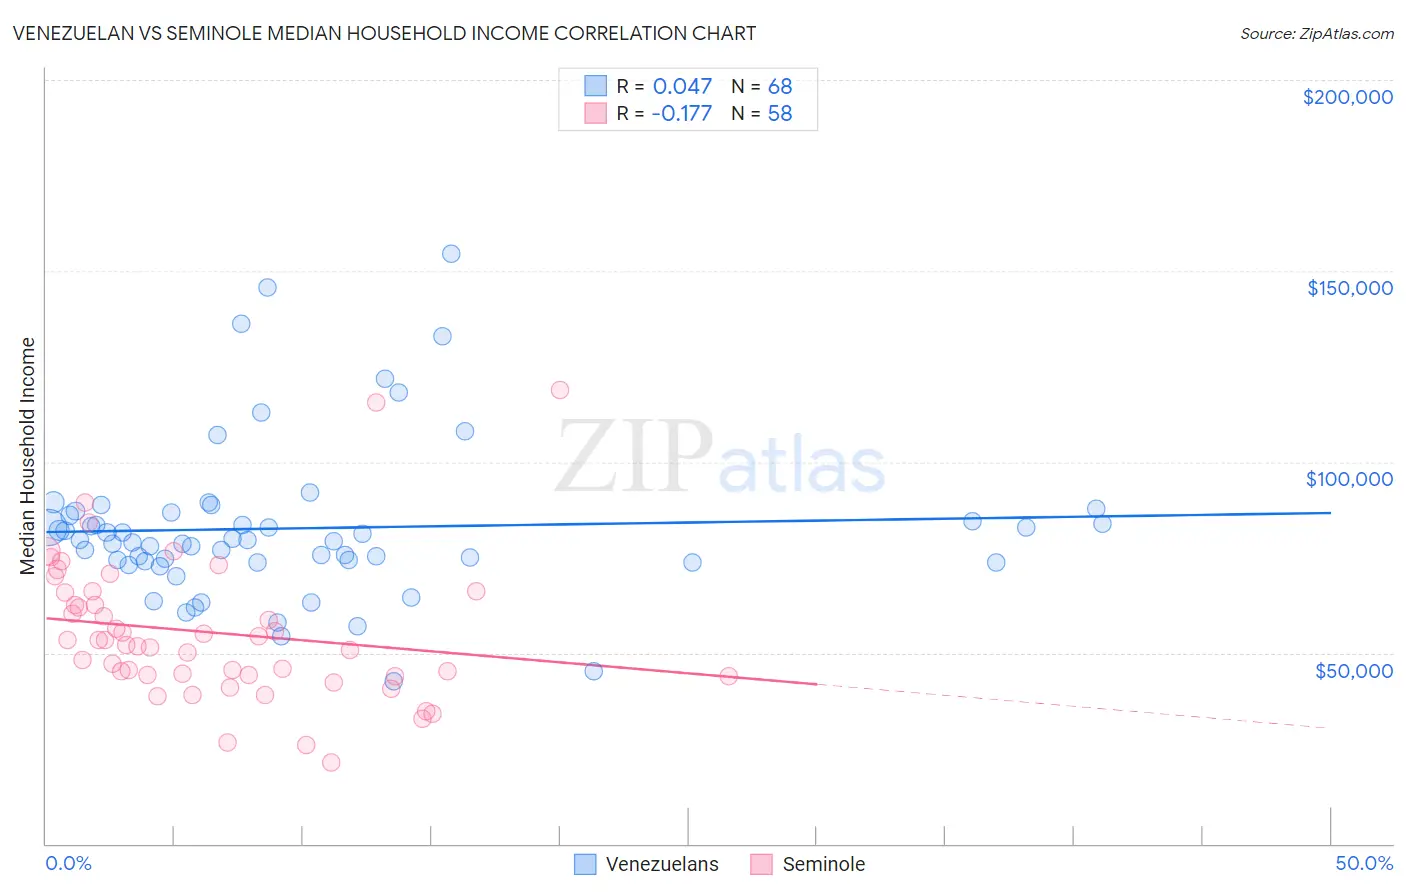
Venezuelan vs Seminole Median Household Income Correlation Chart
The statistical analysis conducted on geographies consisting of 306,067,078 people shows no correlation between the proportion of Venezuelans and median household income in the United States with a correlation coefficient (R) of 0.047 and weighted average of $82,432. Similarly, the statistical analysis conducted on geographies consisting of 118,297,671 people shows a poor negative correlation between the proportion of Seminole and median household income in the United States with a correlation coefficient (R) of -0.177 and weighted average of $69,420, a difference of 18.7%.
Median Household Income Correlation Summary
| Measurement | Venezuelan | Seminole |
| Minimum | $42,664 | $21,429 |
| Maximum | $154,652 | $118,750 |
| Range | $111,988 | $97,321 |
| Mean | $82,593 | $55,357 |
| Median | $79,442 | $52,689 |
| Interquartile 25% (IQ1) | $73,873 | $44,050 |
| Interquartile 75% (IQ3) | $86,330 | $65,850 |
| Interquartile Range (IQR) | $12,458 | $21,800 |
| Standard Deviation (Sample) | $20,652 | $18,667 |
| Standard Deviation (Population) | $20,500 | $18,505 |
Similar Demographics by Median Household Income
Demographics Similar to Venezuelans by Median Household Income
In terms of median household income, the demographic groups most similar to Venezuelans are Salvadoran ($82,449, a difference of 0.020%), Nepalese ($82,410, a difference of 0.030%), Immigrants from Uruguay ($82,560, a difference of 0.16%), Immigrants from Iraq ($82,594, a difference of 0.20%), and Panamanian ($82,272, a difference of 0.20%).
| Demographics | Rating | Rank | Median Household Income |
| Celtics | 22.7 /100 | #205 | Fair $83,193 |
| Immigrants | Kenya | 21.3 /100 | #206 | Fair $83,068 |
| Dutch | 20.3 /100 | #207 | Fair $82,971 |
| French Canadians | 18.7 /100 | #208 | Poor $82,810 |
| Immigrants | Iraq | 16.7 /100 | #209 | Poor $82,594 |
| Immigrants | Uruguay | 16.4 /100 | #210 | Poor $82,560 |
| Salvadorans | 15.4 /100 | #211 | Poor $82,449 |
| Venezuelans | 15.3 /100 | #212 | Poor $82,432 |
| Nepalese | 15.1 /100 | #213 | Poor $82,410 |
| Panamanians | 14.0 /100 | #214 | Poor $82,272 |
| Vietnamese | 13.8 /100 | #215 | Poor $82,248 |
| Yugoslavians | 13.3 /100 | #216 | Poor $82,186 |
| Ecuadorians | 12.5 /100 | #217 | Poor $82,070 |
| Whites/Caucasians | 12.2 /100 | #218 | Poor $82,029 |
| Nigerians | 10.3 /100 | #219 | Poor $81,725 |
Demographics Similar to Seminole by Median Household Income
In terms of median household income, the demographic groups most similar to Seminole are Yup'ik ($69,695, a difference of 0.40%), Bahamian ($69,726, a difference of 0.44%), Choctaw ($69,947, a difference of 0.76%), Chickasaw ($70,005, a difference of 0.84%), and Colville ($70,094, a difference of 0.97%).
| Demographics | Rating | Rank | Median Household Income |
| Chippewa | 0.0 /100 | #318 | Tragic $70,539 |
| Immigrants | Dominican Republic | 0.0 /100 | #319 | Tragic $70,208 |
| Colville | 0.0 /100 | #320 | Tragic $70,094 |
| Chickasaw | 0.0 /100 | #321 | Tragic $70,005 |
| Choctaw | 0.0 /100 | #322 | Tragic $69,947 |
| Bahamians | 0.0 /100 | #323 | Tragic $69,726 |
| Yup'ik | 0.0 /100 | #324 | Tragic $69,695 |
| Seminole | 0.0 /100 | #325 | Tragic $69,420 |
| Yuman | 0.0 /100 | #326 | Tragic $68,743 |
| Immigrants | Cuba | 0.0 /100 | #327 | Tragic $68,461 |
| Menominee | 0.0 /100 | #328 | Tragic $68,423 |
| Dutch West Indians | 0.0 /100 | #329 | Tragic $68,412 |
| Arapaho | 0.0 /100 | #330 | Tragic $67,965 |
| Natives/Alaskans | 0.0 /100 | #331 | Tragic $67,879 |
| Sioux | 0.0 /100 | #332 | Tragic $67,792 |