Venezuelan vs African Median Household Income
COMPARE
Venezuelan
African
Median Household Income
Median Household Income Comparison
Venezuelans
Africans
$82,432
MEDIAN HOUSEHOLD INCOME
15.3/ 100
METRIC RATING
212th/ 347
METRIC RANK
$72,650
MEDIAN HOUSEHOLD INCOME
0.0/ 100
METRIC RATING
303rd/ 347
METRIC RANK
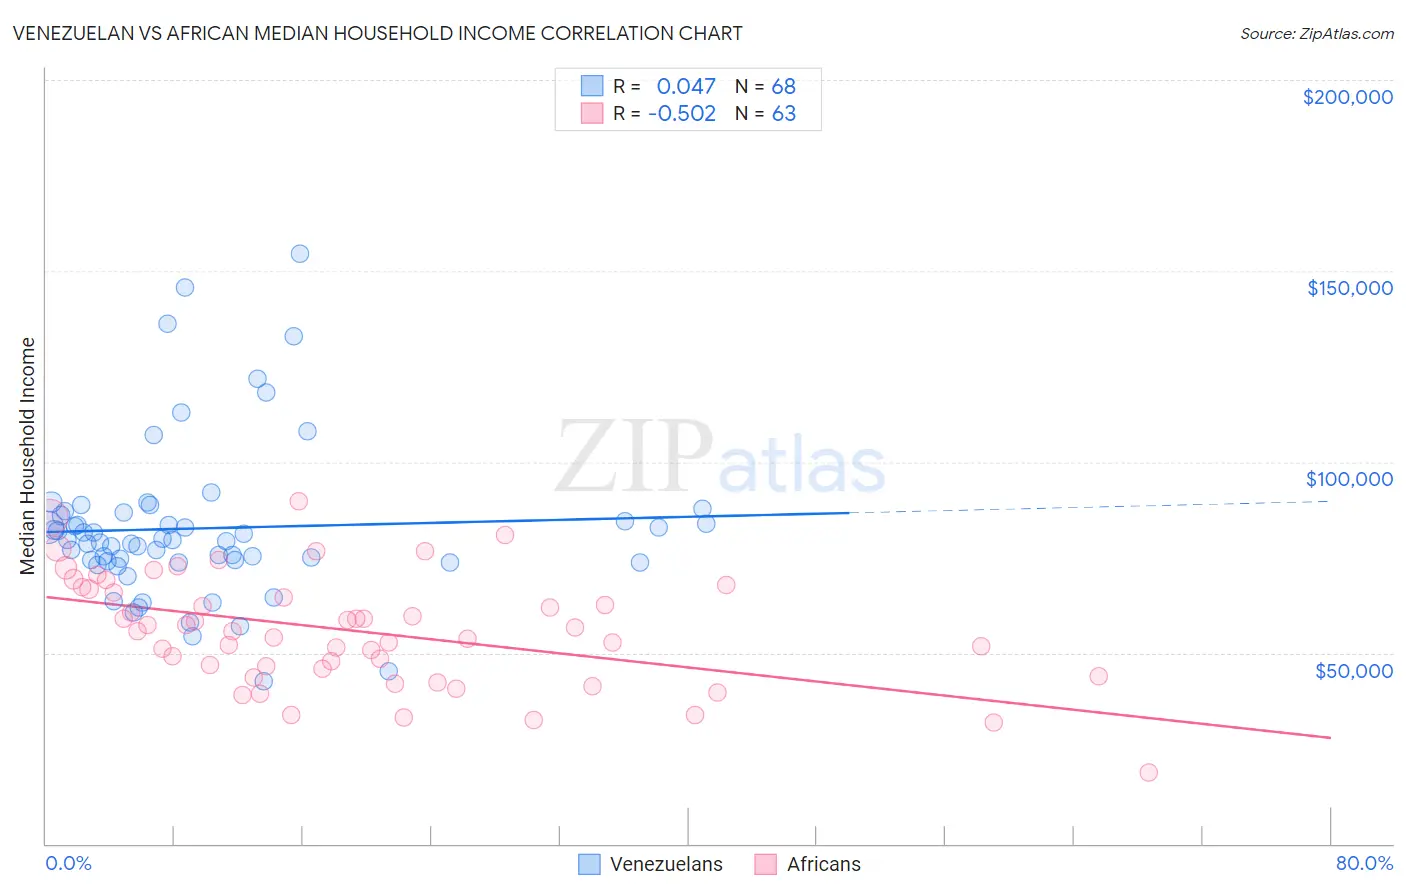
Venezuelan vs African Median Household Income Correlation Chart
The statistical analysis conducted on geographies consisting of 306,067,078 people shows no correlation between the proportion of Venezuelans and median household income in the United States with a correlation coefficient (R) of 0.047 and weighted average of $82,432. Similarly, the statistical analysis conducted on geographies consisting of 469,417,783 people shows a substantial negative correlation between the proportion of Africans and median household income in the United States with a correlation coefficient (R) of -0.502 and weighted average of $72,650, a difference of 13.5%.
Median Household Income Correlation Summary
| Measurement | Venezuelan | African |
| Minimum | $42,664 | $18,750 |
| Maximum | $154,652 | $89,652 |
| Range | $111,988 | $70,902 |
| Mean | $82,593 | $55,711 |
| Median | $79,442 | $55,621 |
| Interquartile 25% (IQ1) | $73,873 | $45,960 |
| Interquartile 75% (IQ3) | $86,330 | $66,633 |
| Interquartile Range (IQR) | $12,458 | $20,673 |
| Standard Deviation (Sample) | $20,652 | $14,453 |
| Standard Deviation (Population) | $20,500 | $14,338 |
Similar Demographics by Median Household Income
Demographics Similar to Venezuelans by Median Household Income
In terms of median household income, the demographic groups most similar to Venezuelans are Salvadoran ($82,449, a difference of 0.020%), Nepalese ($82,410, a difference of 0.030%), Immigrants from Uruguay ($82,560, a difference of 0.16%), Immigrants from Iraq ($82,594, a difference of 0.20%), and Panamanian ($82,272, a difference of 0.20%).
| Demographics | Rating | Rank | Median Household Income |
| Celtics | 22.7 /100 | #205 | Fair $83,193 |
| Immigrants | Kenya | 21.3 /100 | #206 | Fair $83,068 |
| Dutch | 20.3 /100 | #207 | Fair $82,971 |
| French Canadians | 18.7 /100 | #208 | Poor $82,810 |
| Immigrants | Iraq | 16.7 /100 | #209 | Poor $82,594 |
| Immigrants | Uruguay | 16.4 /100 | #210 | Poor $82,560 |
| Salvadorans | 15.4 /100 | #211 | Poor $82,449 |
| Venezuelans | 15.3 /100 | #212 | Poor $82,432 |
| Nepalese | 15.1 /100 | #213 | Poor $82,410 |
| Panamanians | 14.0 /100 | #214 | Poor $82,272 |
| Vietnamese | 13.8 /100 | #215 | Poor $82,248 |
| Yugoslavians | 13.3 /100 | #216 | Poor $82,186 |
| Ecuadorians | 12.5 /100 | #217 | Poor $82,070 |
| Whites/Caucasians | 12.2 /100 | #218 | Poor $82,029 |
| Nigerians | 10.3 /100 | #219 | Poor $81,725 |
Demographics Similar to Africans by Median Household Income
In terms of median household income, the demographic groups most similar to Africans are Shoshone ($72,660, a difference of 0.010%), Cherokee ($72,682, a difference of 0.040%), Immigrants from Haiti ($72,599, a difference of 0.070%), Honduran ($72,588, a difference of 0.090%), and Potawatomi ($72,576, a difference of 0.10%).
| Demographics | Rating | Rank | Median Household Income |
| Haitians | 0.1 /100 | #296 | Tragic $73,306 |
| Immigrants | Mexico | 0.0 /100 | #297 | Tragic $73,160 |
| Paiute | 0.0 /100 | #298 | Tragic $72,959 |
| Indonesians | 0.0 /100 | #299 | Tragic $72,856 |
| Immigrants | Dominica | 0.0 /100 | #300 | Tragic $72,760 |
| Cherokee | 0.0 /100 | #301 | Tragic $72,682 |
| Shoshone | 0.0 /100 | #302 | Tragic $72,660 |
| Africans | 0.0 /100 | #303 | Tragic $72,650 |
| Immigrants | Haiti | 0.0 /100 | #304 | Tragic $72,599 |
| Hondurans | 0.0 /100 | #305 | Tragic $72,588 |
| Potawatomi | 0.0 /100 | #306 | Tragic $72,576 |
| Ute | 0.0 /100 | #307 | Tragic $72,402 |
| Yakama | 0.0 /100 | #308 | Tragic $72,225 |
| Immigrants | Caribbean | 0.0 /100 | #309 | Tragic $71,860 |
| U.S. Virgin Islanders | 0.0 /100 | #310 | Tragic $71,853 |