Immigrants from Latvia vs Immigrants from Hungary Median Household Income
COMPARE
Immigrants from Latvia
Immigrants from Hungary
Median Household Income
Median Household Income Comparison
Immigrants from Latvia
Immigrants from Hungary
$93,602
MEDIAN HOUSEHOLD INCOME
99.6/ 100
METRIC RATING
74th/ 347
METRIC RANK
$92,094
MEDIAN HOUSEHOLD INCOME
98.9/ 100
METRIC RATING
87th/ 347
METRIC RANK
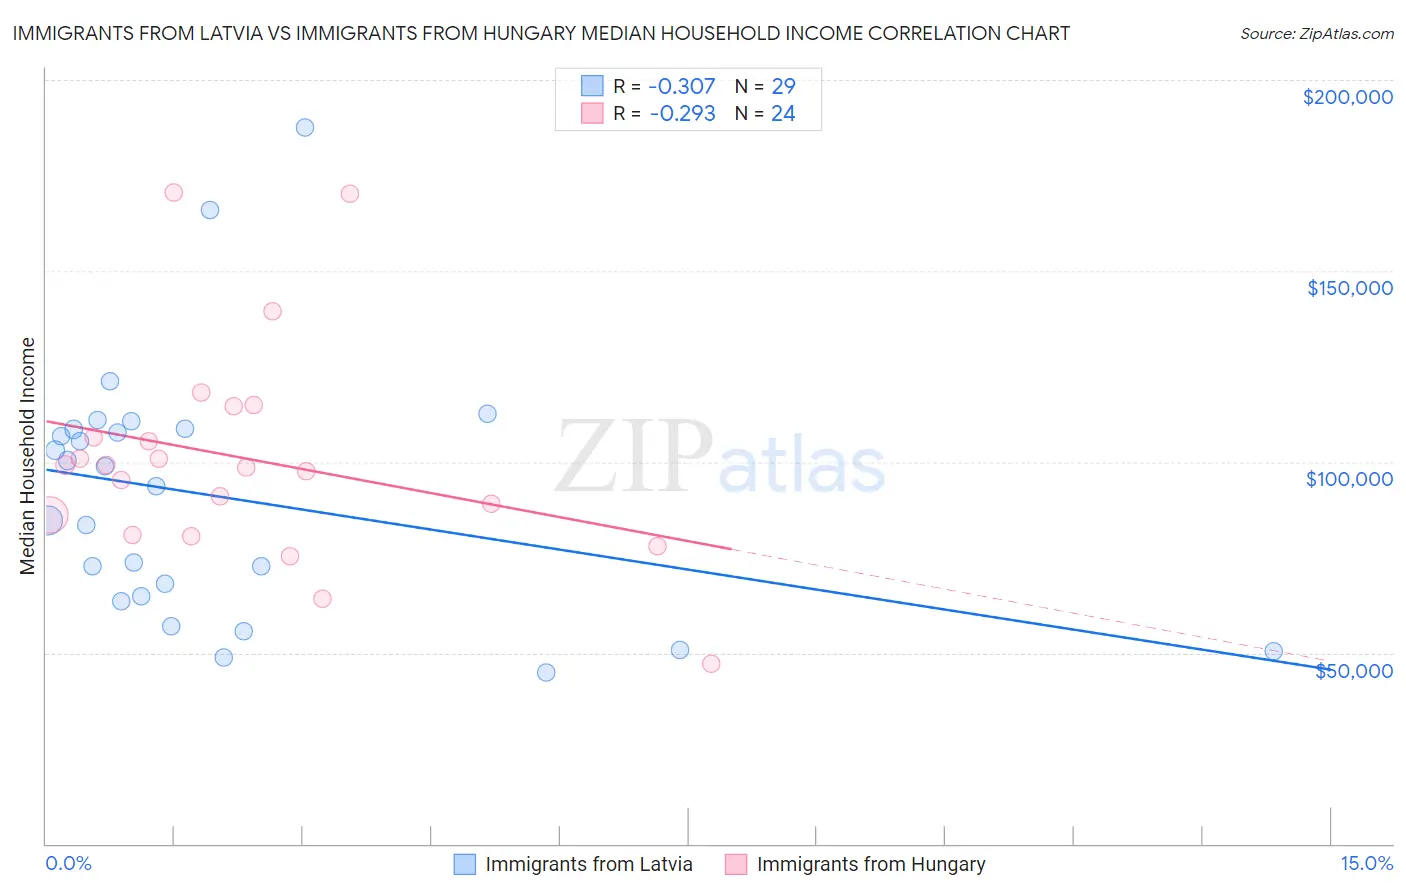
Immigrants from Latvia vs Immigrants from Hungary Median Household Income Correlation Chart
The statistical analysis conducted on geographies consisting of 113,726,313 people shows a mild negative correlation between the proportion of Immigrants from Latvia and median household income in the United States with a correlation coefficient (R) of -0.307 and weighted average of $93,602. Similarly, the statistical analysis conducted on geographies consisting of 195,647,875 people shows a weak negative correlation between the proportion of Immigrants from Hungary and median household income in the United States with a correlation coefficient (R) of -0.293 and weighted average of $92,094, a difference of 1.6%.
Median Household Income Correlation Summary
| Measurement | Immigrants from Latvia | Immigrants from Hungary |
| Minimum | $44,737 | $47,101 |
| Maximum | $187,593 | $170,520 |
| Range | $142,856 | $123,419 |
| Mean | $90,790 | $100,946 |
| Median | $93,558 | $98,883 |
| Interquartile 25% (IQ1) | $64,215 | $83,472 |
| Interquartile 75% (IQ3) | $108,638 | $110,497 |
| Interquartile Range (IQR) | $44,423 | $27,024 |
| Standard Deviation (Sample) | $33,495 | $28,457 |
| Standard Deviation (Population) | $32,912 | $27,858 |
Demographics Similar to Immigrants from Latvia and Immigrants from Hungary by Median Household Income
In terms of median household income, the demographic groups most similar to Immigrants from Latvia are Immigrants from Egypt ($93,700, a difference of 0.10%), Immigrants from Italy ($93,465, a difference of 0.15%), South African ($93,379, a difference of 0.24%), Immigrants from Afghanistan ($93,375, a difference of 0.24%), and Lithuanian ($93,852, a difference of 0.27%). Similarly, the demographic groups most similar to Immigrants from Hungary are Immigrants from England ($92,098, a difference of 0.0%), Immigrants from Canada ($92,029, a difference of 0.070%), Romanian ($91,994, a difference of 0.11%), Assyrian/Chaldean/Syriac ($91,991, a difference of 0.11%), and Immigrants from Croatia ($92,225, a difference of 0.14%).
| Demographics | Rating | Rank | Median Household Income |
| Immigrants | Fiji | 99.7 /100 | #70 | Exceptional $93,933 |
| Immigrants | Philippines | 99.6 /100 | #71 | Exceptional $93,899 |
| Lithuanians | 99.6 /100 | #72 | Exceptional $93,852 |
| Immigrants | Egypt | 99.6 /100 | #73 | Exceptional $93,700 |
| Immigrants | Latvia | 99.6 /100 | #74 | Exceptional $93,602 |
| Immigrants | Italy | 99.5 /100 | #75 | Exceptional $93,465 |
| South Africans | 99.5 /100 | #76 | Exceptional $93,379 |
| Immigrants | Afghanistan | 99.5 /100 | #77 | Exceptional $93,375 |
| Immigrants | Bulgaria | 99.4 /100 | #78 | Exceptional $93,148 |
| Sri Lankans | 99.4 /100 | #79 | Exceptional $93,093 |
| Tongans | 99.4 /100 | #80 | Exceptional $93,076 |
| Immigrants | Eastern Europe | 99.4 /100 | #81 | Exceptional $93,051 |
| Immigrants | Spain | 99.3 /100 | #82 | Exceptional $92,732 |
| Italians | 99.1 /100 | #83 | Exceptional $92,475 |
| Immigrants | Argentina | 99.1 /100 | #84 | Exceptional $92,417 |
| Immigrants | Croatia | 99.0 /100 | #85 | Exceptional $92,225 |
| Immigrants | England | 98.9 /100 | #86 | Exceptional $92,098 |
| Immigrants | Hungary | 98.9 /100 | #87 | Exceptional $92,094 |
| Immigrants | Canada | 98.8 /100 | #88 | Exceptional $92,029 |
| Romanians | 98.8 /100 | #89 | Exceptional $91,994 |
| Assyrians/Chaldeans/Syriacs | 98.8 /100 | #90 | Exceptional $91,991 |