Delaware vs Immigrants from Hungary Median Household Income
COMPARE
Delaware
Immigrants from Hungary
Median Household Income
Median Household Income Comparison
Delaware
Immigrants from Hungary
$80,527
MEDIAN HOUSEHOLD INCOME
5.0/ 100
METRIC RATING
229th/ 347
METRIC RANK
$92,094
MEDIAN HOUSEHOLD INCOME
98.9/ 100
METRIC RATING
87th/ 347
METRIC RANK
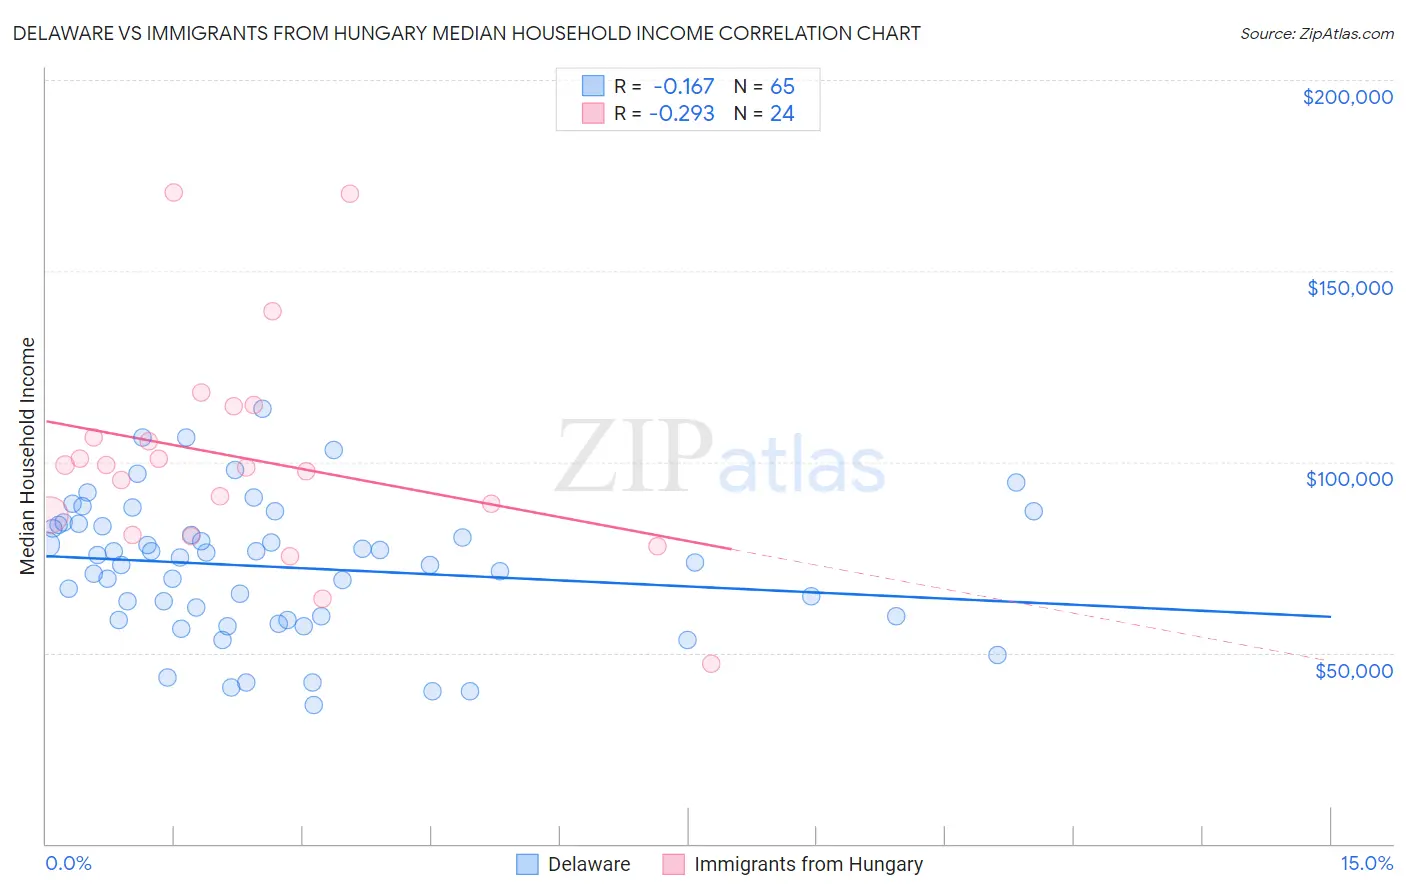
Delaware vs Immigrants from Hungary Median Household Income Correlation Chart
The statistical analysis conducted on geographies consisting of 96,222,020 people shows a poor negative correlation between the proportion of Delaware and median household income in the United States with a correlation coefficient (R) of -0.167 and weighted average of $80,527. Similarly, the statistical analysis conducted on geographies consisting of 195,647,875 people shows a weak negative correlation between the proportion of Immigrants from Hungary and median household income in the United States with a correlation coefficient (R) of -0.293 and weighted average of $92,094, a difference of 14.4%.
Median Household Income Correlation Summary
| Measurement | Delaware | Immigrants from Hungary |
| Minimum | $36,250 | $47,101 |
| Maximum | $113,889 | $170,520 |
| Range | $77,639 | $123,419 |
| Mean | $72,395 | $100,946 |
| Median | $74,896 | $98,883 |
| Interquartile 25% (IQ1) | $59,089 | $83,472 |
| Interquartile 75% (IQ3) | $83,725 | $110,497 |
| Interquartile Range (IQR) | $24,635 | $27,024 |
| Standard Deviation (Sample) | $17,722 | $28,457 |
| Standard Deviation (Population) | $17,585 | $27,858 |
Similar Demographics by Median Household Income
Demographics Similar to Delaware by Median Household Income
In terms of median household income, the demographic groups most similar to Delaware are Bermudan ($80,406, a difference of 0.15%), Trinidadian and Tobagonian ($80,402, a difference of 0.16%), Immigrants from Trinidad and Tobago ($80,373, a difference of 0.19%), Immigrants from the Azores ($80,357, a difference of 0.21%), and Immigrants from Ecuador ($80,341, a difference of 0.23%).
| Demographics | Rating | Rank | Median Household Income |
| Immigrants | Nigeria | 7.7 /100 | #222 | Tragic $81,236 |
| Immigrants | El Salvador | 7.6 /100 | #223 | Tragic $81,213 |
| Malaysians | 7.0 /100 | #224 | Tragic $81,064 |
| Scotch-Irish | 6.6 /100 | #225 | Tragic $80,972 |
| Immigrants | Panama | 6.2 /100 | #226 | Tragic $80,873 |
| Guyanese | 5.7 /100 | #227 | Tragic $80,734 |
| Immigrants | Bangladesh | 5.7 /100 | #228 | Tragic $80,722 |
| Delaware | 5.0 /100 | #229 | Tragic $80,527 |
| Bermudans | 4.7 /100 | #230 | Tragic $80,406 |
| Trinidadians and Tobagonians | 4.7 /100 | #231 | Tragic $80,402 |
| Immigrants | Trinidad and Tobago | 4.6 /100 | #232 | Tragic $80,373 |
| Immigrants | Azores | 4.5 /100 | #233 | Tragic $80,357 |
| Immigrants | Ecuador | 4.5 /100 | #234 | Tragic $80,341 |
| Immigrants | Guyana | 4.5 /100 | #235 | Tragic $80,324 |
| Immigrants | Bosnia and Herzegovina | 3.4 /100 | #236 | Tragic $79,888 |
Demographics Similar to Immigrants from Hungary by Median Household Income
In terms of median household income, the demographic groups most similar to Immigrants from Hungary are Immigrants from England ($92,098, a difference of 0.0%), Immigrants from Canada ($92,029, a difference of 0.070%), Romanian ($91,994, a difference of 0.11%), Assyrian/Chaldean/Syriac ($91,991, a difference of 0.11%), and Immigrants from Vietnam ($91,987, a difference of 0.12%).
| Demographics | Rating | Rank | Median Household Income |
| Tongans | 99.4 /100 | #80 | Exceptional $93,076 |
| Immigrants | Eastern Europe | 99.4 /100 | #81 | Exceptional $93,051 |
| Immigrants | Spain | 99.3 /100 | #82 | Exceptional $92,732 |
| Italians | 99.1 /100 | #83 | Exceptional $92,475 |
| Immigrants | Argentina | 99.1 /100 | #84 | Exceptional $92,417 |
| Immigrants | Croatia | 99.0 /100 | #85 | Exceptional $92,225 |
| Immigrants | England | 98.9 /100 | #86 | Exceptional $92,098 |
| Immigrants | Hungary | 98.9 /100 | #87 | Exceptional $92,094 |
| Immigrants | Canada | 98.8 /100 | #88 | Exceptional $92,029 |
| Romanians | 98.8 /100 | #89 | Exceptional $91,994 |
| Assyrians/Chaldeans/Syriacs | 98.8 /100 | #90 | Exceptional $91,991 |
| Immigrants | Vietnam | 98.8 /100 | #91 | Exceptional $91,987 |
| Immigrants | Western Europe | 98.8 /100 | #92 | Exceptional $91,936 |
| Immigrants | Lebanon | 98.7 /100 | #93 | Exceptional $91,887 |
| Immigrants | North America | 98.7 /100 | #94 | Exceptional $91,860 |