Ute vs Portuguese Unemployment Among Ages 25 to 29 years
COMPARE
Ute
Portuguese
Unemployment Among Ages 25 to 29 years
Unemployment Among Ages 25 to 29 years Comparison
Ute
Portuguese
6.8%
UNEMPLOYMENT AMONG AGES 25 TO 29 YEARS
13.4/ 100
METRIC RATING
217th/ 347
METRIC RANK
7.2%
UNEMPLOYMENT AMONG AGES 25 TO 29 YEARS
0.5/ 100
METRIC RATING
251st/ 347
METRIC RANK
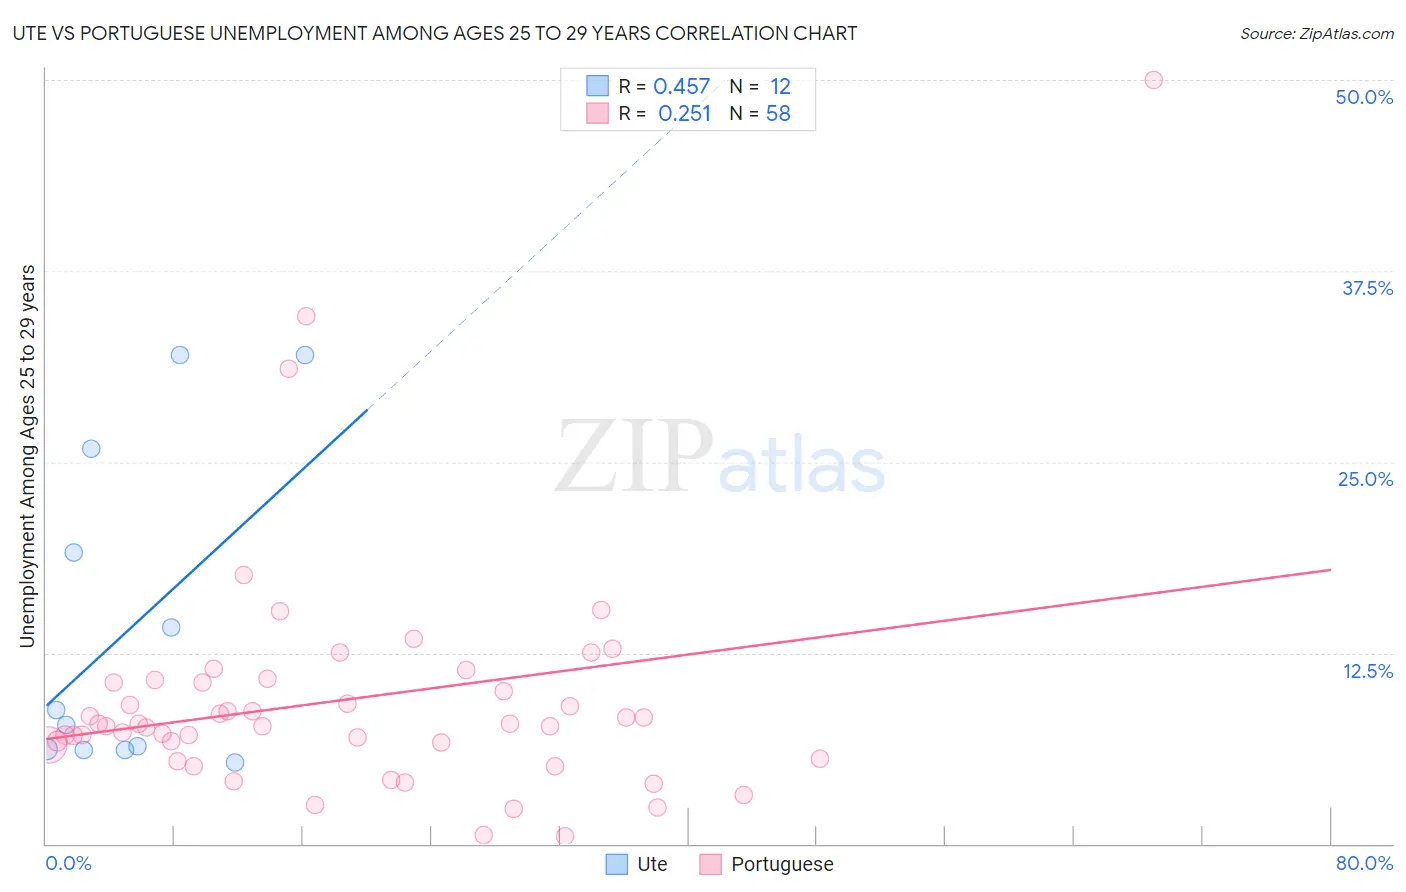
Ute vs Portuguese Unemployment Among Ages 25 to 29 years Correlation Chart
The statistical analysis conducted on geographies consisting of 54,814,221 people shows a moderate positive correlation between the proportion of Ute and unemployment rate among population between the ages 25 and 29 in the United States with a correlation coefficient (R) of 0.457 and weighted average of 6.8%. Similarly, the statistical analysis conducted on geographies consisting of 421,376,294 people shows a weak positive correlation between the proportion of Portuguese and unemployment rate among population between the ages 25 and 29 in the United States with a correlation coefficient (R) of 0.251 and weighted average of 7.2%, a difference of 5.1%.
Unemployment Among Ages 25 to 29 years Correlation Summary
| Measurement | Ute | Portuguese |
| Minimum | 5.3% | 0.50% |
| Maximum | 32.0% | 50.0% |
| Range | 26.7% | 49.5% |
| Mean | 14.1% | 9.5% |
| Median | 8.2% | 7.8% |
| Interquartile 25% (IQ1) | 6.2% | 6.5% |
| Interquartile 75% (IQ3) | 22.5% | 10.6% |
| Interquartile Range (IQR) | 16.3% | 4.1% |
| Standard Deviation (Sample) | 10.4% | 7.9% |
| Standard Deviation (Population) | 10.0% | 7.8% |
Similar Demographics by Unemployment Among Ages 25 to 29 years
Demographics Similar to Ute by Unemployment Among Ages 25 to 29 years
In terms of unemployment among ages 25 to 29 years, the demographic groups most similar to Ute are Slovak (6.8%, a difference of 0.11%), Spanish (6.8%, a difference of 0.13%), Immigrants from Austria (6.8%, a difference of 0.14%), Liberian (6.8%, a difference of 0.16%), and Immigrants from Syria (6.8%, a difference of 0.21%).
| Demographics | Rating | Rank | Unemployment Among Ages 25 to 29 years |
| Canadians | 16.9 /100 | #210 | Poor 6.8% |
| Immigrants | Philippines | 16.7 /100 | #211 | Poor 6.8% |
| Immigrants | Cabo Verde | 16.2 /100 | #212 | Poor 6.8% |
| Immigrants | Syria | 15.1 /100 | #213 | Poor 6.8% |
| Liberians | 14.7 /100 | #214 | Poor 6.8% |
| Spanish | 14.4 /100 | #215 | Poor 6.8% |
| Slovaks | 14.3 /100 | #216 | Poor 6.8% |
| Ute | 13.4 /100 | #217 | Poor 6.8% |
| Immigrants | Austria | 12.3 /100 | #218 | Poor 6.8% |
| Whites/Caucasians | 10.6 /100 | #219 | Poor 6.9% |
| French | 10.5 /100 | #220 | Poor 6.9% |
| Israelis | 9.8 /100 | #221 | Tragic 6.9% |
| Spaniards | 7.7 /100 | #222 | Tragic 6.9% |
| Celtics | 7.6 /100 | #223 | Tragic 6.9% |
| Immigrants | Immigrants | 6.2 /100 | #224 | Tragic 6.9% |
Demographics Similar to Portuguese by Unemployment Among Ages 25 to 29 years
In terms of unemployment among ages 25 to 29 years, the demographic groups most similar to Portuguese are Delaware (7.2%, a difference of 0.060%), Seminole (7.2%, a difference of 0.22%), Subsaharan African (7.2%, a difference of 0.25%), Sierra Leonean (7.2%, a difference of 0.26%), and Immigrants from Guatemala (7.2%, a difference of 0.41%).
| Demographics | Rating | Rank | Unemployment Among Ages 25 to 29 years |
| Immigrants | Nonimmigrants | 0.9 /100 | #244 | Tragic 7.1% |
| Guatemalans | 0.9 /100 | #245 | Tragic 7.1% |
| Immigrants | Uzbekistan | 0.7 /100 | #246 | Tragic 7.2% |
| Immigrants | Guatemala | 0.7 /100 | #247 | Tragic 7.2% |
| Sub-Saharan Africans | 0.6 /100 | #248 | Tragic 7.2% |
| Seminole | 0.6 /100 | #249 | Tragic 7.2% |
| Delaware | 0.5 /100 | #250 | Tragic 7.2% |
| Portuguese | 0.5 /100 | #251 | Tragic 7.2% |
| Sierra Leoneans | 0.4 /100 | #252 | Tragic 7.2% |
| Immigrants | Portugal | 0.3 /100 | #253 | Tragic 7.2% |
| Ghanaians | 0.3 /100 | #254 | Tragic 7.2% |
| Immigrants | Cameroon | 0.3 /100 | #255 | Tragic 7.2% |
| Mexican American Indians | 0.3 /100 | #256 | Tragic 7.3% |
| Assyrians/Chaldeans/Syriacs | 0.2 /100 | #257 | Tragic 7.3% |
| Ottawa | 0.1 /100 | #258 | Tragic 7.3% |