Ute vs Alaska Native Median Family Income
COMPARE
Ute
Alaska Native
Median Family Income
Median Family Income Comparison
Ute
Alaska Natives
$87,596
MEDIAN FAMILY INCOME
0.0/ 100
METRIC RATING
293rd/ 347
METRIC RANK
$95,573
MEDIAN FAMILY INCOME
2.6/ 100
METRIC RATING
227th/ 347
METRIC RANK
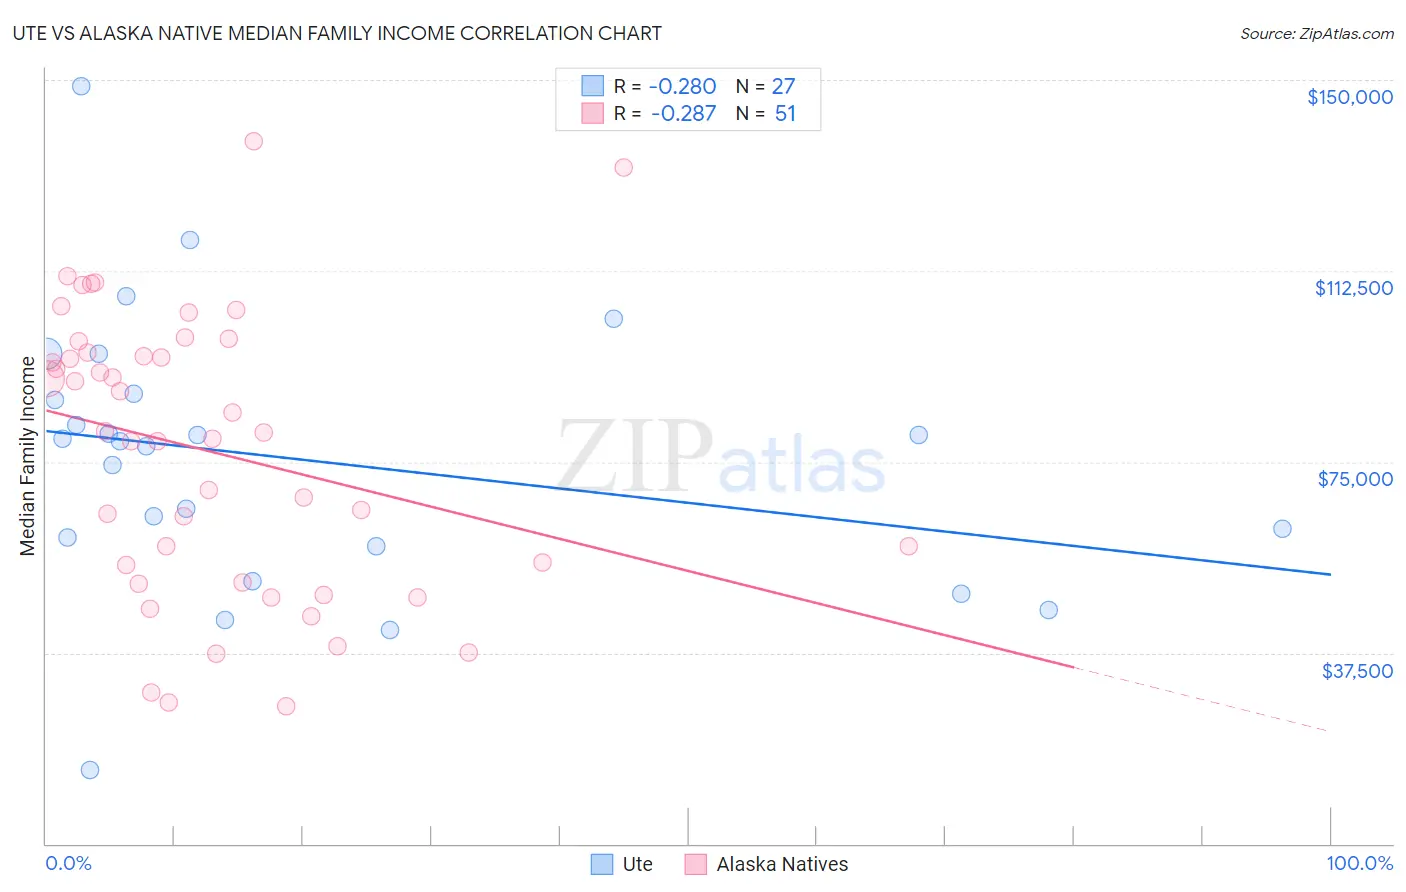
Ute vs Alaska Native Median Family Income Correlation Chart
The statistical analysis conducted on geographies consisting of 55,656,168 people shows a weak negative correlation between the proportion of Ute and median family income in the United States with a correlation coefficient (R) of -0.280 and weighted average of $87,596. Similarly, the statistical analysis conducted on geographies consisting of 76,737,851 people shows a weak negative correlation between the proportion of Alaska Natives and median family income in the United States with a correlation coefficient (R) of -0.287 and weighted average of $95,573, a difference of 9.1%.
Median Family Income Correlation Summary
| Measurement | Ute | Alaska Native |
| Minimum | $14,519 | $27,083 |
| Maximum | $148,724 | $137,917 |
| Range | $134,205 | $110,834 |
| Mean | $75,455 | $77,054 |
| Median | $78,980 | $80,833 |
| Interquartile 25% (IQ1) | $58,333 | $51,316 |
| Interquartile 75% (IQ3) | $88,500 | $96,369 |
| Interquartile Range (IQR) | $30,167 | $45,053 |
| Standard Deviation (Sample) | $27,197 | $27,527 |
| Standard Deviation (Population) | $26,688 | $27,256 |
Similar Demographics by Median Family Income
Demographics Similar to Ute by Median Family Income
In terms of median family income, the demographic groups most similar to Ute are Fijian ($87,387, a difference of 0.24%), African ($87,820, a difference of 0.26%), Immigrants from Cabo Verde ($87,830, a difference of 0.27%), Shoshone ($87,872, a difference of 0.32%), and Yaqui ($87,289, a difference of 0.35%).
| Demographics | Rating | Rank | Median Family Income |
| Immigrants | Nicaragua | 0.1 /100 | #286 | Tragic $88,267 |
| Potawatomi | 0.1 /100 | #287 | Tragic $88,265 |
| Cherokee | 0.1 /100 | #288 | Tragic $88,209 |
| Central American Indians | 0.1 /100 | #289 | Tragic $88,034 |
| Shoshone | 0.1 /100 | #290 | Tragic $87,872 |
| Immigrants | Cabo Verde | 0.1 /100 | #291 | Tragic $87,830 |
| Africans | 0.1 /100 | #292 | Tragic $87,820 |
| Ute | 0.0 /100 | #293 | Tragic $87,596 |
| Fijians | 0.0 /100 | #294 | Tragic $87,387 |
| Yaqui | 0.0 /100 | #295 | Tragic $87,289 |
| Immigrants | Guatemala | 0.0 /100 | #296 | Tragic $87,191 |
| Cajuns | 0.0 /100 | #297 | Tragic $87,157 |
| Immigrants | Latin America | 0.0 /100 | #298 | Tragic $86,989 |
| Chippewa | 0.0 /100 | #299 | Tragic $86,852 |
| Ottawa | 0.0 /100 | #300 | Tragic $86,380 |
Demographics Similar to Alaska Natives by Median Family Income
In terms of median family income, the demographic groups most similar to Alaska Natives are Immigrants from Panama ($95,647, a difference of 0.080%), Immigrants from the Azores ($95,402, a difference of 0.18%), Marshallese ($95,293, a difference of 0.29%), Malaysian ($95,230, a difference of 0.36%), and Ecuadorian ($95,114, a difference of 0.48%).
| Demographics | Rating | Rank | Median Family Income |
| Sudanese | 4.7 /100 | #220 | Tragic $96,783 |
| Immigrants | Ghana | 4.2 /100 | #221 | Tragic $96,544 |
| Immigrants | Nigeria | 4.0 /100 | #222 | Tragic $96,439 |
| Venezuelans | 3.7 /100 | #223 | Tragic $96,281 |
| Immigrants | Nonimmigrants | 3.6 /100 | #224 | Tragic $96,231 |
| Vietnamese | 3.4 /100 | #225 | Tragic $96,123 |
| Immigrants | Panama | 2.7 /100 | #226 | Tragic $95,647 |
| Alaska Natives | 2.6 /100 | #227 | Tragic $95,573 |
| Immigrants | Azores | 2.4 /100 | #228 | Tragic $95,402 |
| Marshallese | 2.2 /100 | #229 | Tragic $95,293 |
| Malaysians | 2.2 /100 | #230 | Tragic $95,230 |
| Ecuadorians | 2.1 /100 | #231 | Tragic $95,114 |
| Immigrants | Venezuela | 1.9 /100 | #232 | Tragic $94,904 |
| Immigrants | Bangladesh | 1.6 /100 | #233 | Tragic $94,665 |
| Immigrants | Western Africa | 1.6 /100 | #234 | Tragic $94,638 |