Ute vs French Median Female Earnings
COMPARE
Ute
French
Median Female Earnings
Median Female Earnings Comparison
Ute
French
$34,960
MEDIAN FEMALE EARNINGS
0.0/ 100
METRIC RATING
311th/ 347
METRIC RANK
$38,457
MEDIAN FEMALE EARNINGS
7.0/ 100
METRIC RATING
225th/ 347
METRIC RANK
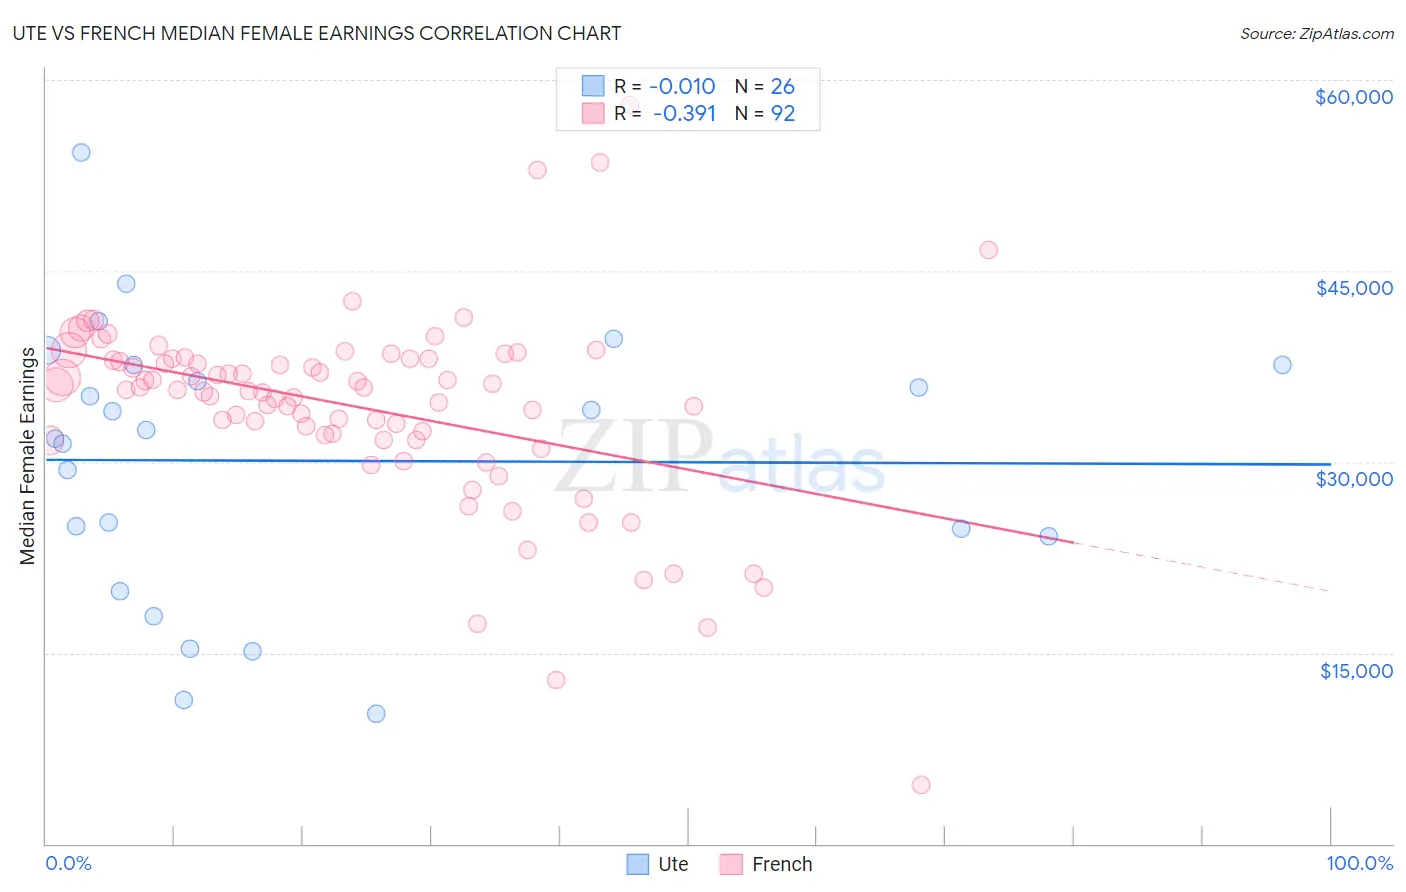
Ute vs French Median Female Earnings Correlation Chart
The statistical analysis conducted on geographies consisting of 55,659,535 people shows no correlation between the proportion of Ute and median female earnings in the United States with a correlation coefficient (R) of -0.010 and weighted average of $34,960. Similarly, the statistical analysis conducted on geographies consisting of 570,640,239 people shows a mild negative correlation between the proportion of French and median female earnings in the United States with a correlation coefficient (R) of -0.391 and weighted average of $38,457, a difference of 10.0%.
Median Female Earnings Correlation Summary
| Measurement | Ute | French |
| Minimum | $10,250 | $4,625 |
| Maximum | $54,350 | $58,008 |
| Range | $44,100 | $53,383 |
| Mean | $30,088 | $34,289 |
| Median | $32,195 | $35,683 |
| Interquartile 25% (IQ1) | $24,148 | $31,891 |
| Interquartile 75% (IQ3) | $37,604 | $38,063 |
| Interquartile Range (IQR) | $13,456 | $6,171 |
| Standard Deviation (Sample) | $10,734 | $7,750 |
| Standard Deviation (Population) | $10,525 | $7,708 |
Similar Demographics by Median Female Earnings
Demographics Similar to Ute by Median Female Earnings
In terms of median female earnings, the demographic groups most similar to Ute are Yaqui ($34,943, a difference of 0.050%), Cuban ($34,942, a difference of 0.050%), Chippewa ($35,003, a difference of 0.12%), Honduran ($35,013, a difference of 0.15%), and Immigrants from Bahamas ($35,027, a difference of 0.19%).
| Demographics | Rating | Rank | Median Female Earnings |
| Crow | 0.0 /100 | #304 | Tragic $35,266 |
| Bahamians | 0.0 /100 | #305 | Tragic $35,125 |
| Fijians | 0.0 /100 | #306 | Tragic $35,114 |
| Sioux | 0.0 /100 | #307 | Tragic $35,063 |
| Immigrants | Bahamas | 0.0 /100 | #308 | Tragic $35,027 |
| Hondurans | 0.0 /100 | #309 | Tragic $35,013 |
| Chippewa | 0.0 /100 | #310 | Tragic $35,003 |
| Ute | 0.0 /100 | #311 | Tragic $34,960 |
| Yaqui | 0.0 /100 | #312 | Tragic $34,943 |
| Cubans | 0.0 /100 | #313 | Tragic $34,942 |
| Apache | 0.0 /100 | #314 | Tragic $34,895 |
| Pennsylvania Germans | 0.0 /100 | #315 | Tragic $34,802 |
| Cherokee | 0.0 /100 | #316 | Tragic $34,742 |
| Potawatomi | 0.0 /100 | #317 | Tragic $34,739 |
| Immigrants | Yemen | 0.0 /100 | #318 | Tragic $34,693 |
Demographics Similar to French by Median Female Earnings
In terms of median female earnings, the demographic groups most similar to French are Native Hawaiian ($38,461, a difference of 0.010%), French Canadian ($38,436, a difference of 0.050%), Immigrants from Sudan ($38,511, a difference of 0.14%), Scottish ($38,397, a difference of 0.15%), and Subsaharan African ($38,391, a difference of 0.17%).
| Demographics | Rating | Rank | Median Female Earnings |
| Cape Verdeans | 9.5 /100 | #218 | Tragic $38,614 |
| Nepalese | 9.3 /100 | #219 | Tragic $38,603 |
| Yugoslavians | 8.8 /100 | #220 | Tragic $38,573 |
| Immigrants | Azores | 8.8 /100 | #221 | Tragic $38,573 |
| Japanese | 8.1 /100 | #222 | Tragic $38,528 |
| Immigrants | Sudan | 7.8 /100 | #223 | Tragic $38,511 |
| Native Hawaiians | 7.1 /100 | #224 | Tragic $38,461 |
| French | 7.0 /100 | #225 | Tragic $38,457 |
| French Canadians | 6.8 /100 | #226 | Tragic $38,436 |
| Scottish | 6.3 /100 | #227 | Tragic $38,397 |
| Sub-Saharan Africans | 6.2 /100 | #228 | Tragic $38,391 |
| Belgians | 6.1 /100 | #229 | Tragic $38,382 |
| Basques | 5.7 /100 | #230 | Tragic $38,352 |
| Somalis | 5.5 /100 | #231 | Tragic $38,333 |
| Scandinavians | 5.2 /100 | #232 | Tragic $38,306 |