Ute vs Canadian Householder Income Over 65 years
COMPARE
Ute
Canadian
Householder Income Over 65 years
Householder Income Over 65 years Comparison
Ute
Canadians
$52,949
HOUSEHOLDER INCOME OVER 65 YEARS
0.0/ 100
METRIC RATING
304th/ 347
METRIC RANK
$62,230
HOUSEHOLDER INCOME OVER 65 YEARS
79.0/ 100
METRIC RATING
141st/ 347
METRIC RANK
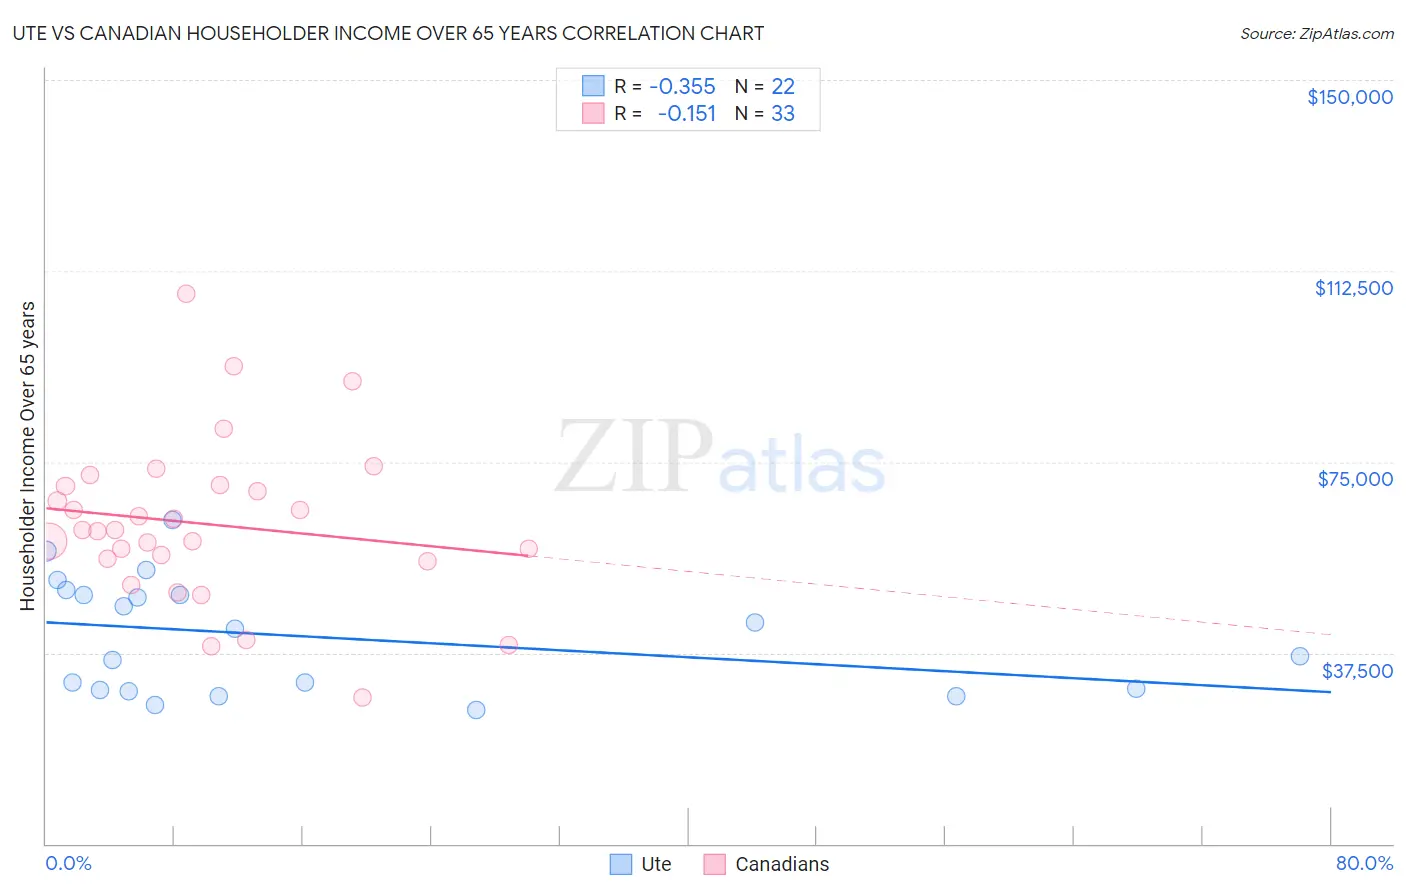
Ute vs Canadian Householder Income Over 65 years Correlation Chart
The statistical analysis conducted on geographies consisting of 55,627,280 people shows a mild negative correlation between the proportion of Ute and household income with householder over the age of 65 in the United States with a correlation coefficient (R) of -0.355 and weighted average of $52,949. Similarly, the statistical analysis conducted on geographies consisting of 436,051,930 people shows a poor negative correlation between the proportion of Canadians and household income with householder over the age of 65 in the United States with a correlation coefficient (R) of -0.151 and weighted average of $62,230, a difference of 17.5%.
Householder Income Over 65 years Correlation Summary
| Measurement | Ute | Canadian |
| Minimum | $26,154 | $28,616 |
| Maximum | $63,482 | $108,103 |
| Range | $37,328 | $79,487 |
| Mean | $40,597 | $62,811 |
| Median | $39,530 | $61,617 |
| Interquartile 25% (IQ1) | $30,250 | $55,674 |
| Interquartile 75% (IQ3) | $48,922 | $70,369 |
| Interquartile Range (IQR) | $18,672 | $14,695 |
| Standard Deviation (Sample) | $11,138 | $16,050 |
| Standard Deviation (Population) | $10,882 | $15,805 |
Similar Demographics by Householder Income Over 65 years
Demographics Similar to Ute by Householder Income Over 65 years
In terms of householder income over 65 years, the demographic groups most similar to Ute are Pueblo ($52,930, a difference of 0.040%), Pennsylvania German ($52,888, a difference of 0.11%), Choctaw ($53,060, a difference of 0.21%), Hispanic or Latino ($52,832, a difference of 0.22%), and Spanish American Indian ($53,077, a difference of 0.24%).
| Demographics | Rating | Rank | Householder Income Over 65 years |
| Immigrants | Latin America | 0.0 /100 | #297 | Tragic $53,265 |
| Central American Indians | 0.0 /100 | #298 | Tragic $53,232 |
| Ottawa | 0.0 /100 | #299 | Tragic $53,217 |
| Immigrants | Bahamas | 0.0 /100 | #300 | Tragic $53,174 |
| Yuman | 0.0 /100 | #301 | Tragic $53,110 |
| Spanish American Indians | 0.0 /100 | #302 | Tragic $53,077 |
| Choctaw | 0.0 /100 | #303 | Tragic $53,060 |
| Ute | 0.0 /100 | #304 | Tragic $52,949 |
| Pueblo | 0.0 /100 | #305 | Tragic $52,930 |
| Pennsylvania Germans | 0.0 /100 | #306 | Tragic $52,888 |
| Hispanics or Latinos | 0.0 /100 | #307 | Tragic $52,832 |
| Immigrants | Mexico | 0.0 /100 | #308 | Tragic $52,801 |
| Hondurans | 0.0 /100 | #309 | Tragic $52,634 |
| Sioux | 0.0 /100 | #310 | Tragic $52,509 |
| Seminole | 0.0 /100 | #311 | Tragic $52,373 |
Demographics Similar to Canadians by Householder Income Over 65 years
In terms of householder income over 65 years, the demographic groups most similar to Canadians are South American Indian ($62,215, a difference of 0.020%), Arab ($62,266, a difference of 0.060%), Lebanese ($62,287, a difference of 0.090%), Immigrants from Kazakhstan ($62,292, a difference of 0.10%), and Immigrants from Belarus ($62,162, a difference of 0.11%).
| Demographics | Rating | Rank | Householder Income Over 65 years |
| Immigrants | Brazil | 81.2 /100 | #134 | Excellent $62,364 |
| Immigrants | Chile | 81.0 /100 | #135 | Excellent $62,354 |
| Alaskan Athabascans | 80.6 /100 | #136 | Excellent $62,330 |
| Immigrants | Syria | 80.2 /100 | #137 | Excellent $62,303 |
| Immigrants | Kazakhstan | 80.0 /100 | #138 | Excellent $62,292 |
| Lebanese | 79.9 /100 | #139 | Good $62,287 |
| Arabs | 79.6 /100 | #140 | Good $62,266 |
| Canadians | 79.0 /100 | #141 | Good $62,230 |
| South American Indians | 78.7 /100 | #142 | Good $62,215 |
| Immigrants | Belarus | 77.8 /100 | #143 | Good $62,162 |
| Immigrants | Peru | 74.4 /100 | #144 | Good $61,988 |
| Immigrants | Uganda | 74.2 /100 | #145 | Good $61,976 |
| Immigrants | Southern Europe | 72.7 /100 | #146 | Good $61,902 |
| Immigrants | Nepal | 71.4 /100 | #147 | Good $61,843 |
| Alsatians | 70.5 /100 | #148 | Good $61,797 |