Ute vs Immigrants from Sweden Householder Income Over 65 years
COMPARE
Ute
Immigrants from Sweden
Householder Income Over 65 years
Householder Income Over 65 years Comparison
Ute
Immigrants from Sweden
$52,949
HOUSEHOLDER INCOME OVER 65 YEARS
0.0/ 100
METRIC RATING
304th/ 347
METRIC RANK
$69,722
HOUSEHOLDER INCOME OVER 65 YEARS
100.0/ 100
METRIC RATING
24th/ 347
METRIC RANK
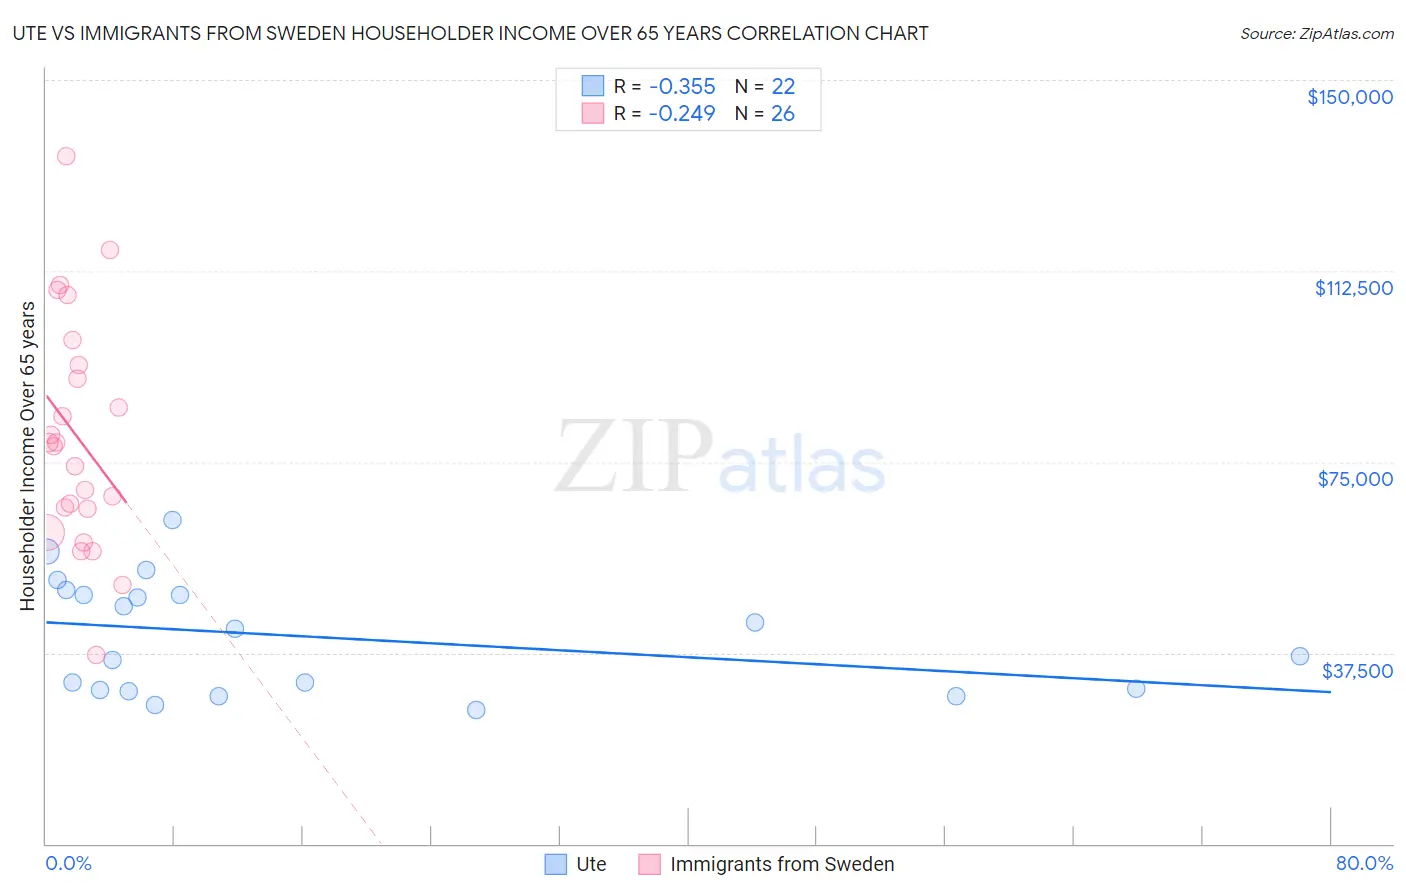
Ute vs Immigrants from Sweden Householder Income Over 65 years Correlation Chart
The statistical analysis conducted on geographies consisting of 55,627,280 people shows a mild negative correlation between the proportion of Ute and household income with householder over the age of 65 in the United States with a correlation coefficient (R) of -0.355 and weighted average of $52,949. Similarly, the statistical analysis conducted on geographies consisting of 164,544,707 people shows a weak negative correlation between the proportion of Immigrants from Sweden and household income with householder over the age of 65 in the United States with a correlation coefficient (R) of -0.249 and weighted average of $69,722, a difference of 31.7%.
Householder Income Over 65 years Correlation Summary
| Measurement | Ute | Immigrants from Sweden |
| Minimum | $26,154 | $37,004 |
| Maximum | $63,482 | $135,117 |
| Range | $37,328 | $98,113 |
| Mean | $40,597 | $80,048 |
| Median | $39,530 | $78,384 |
| Interquartile 25% (IQ1) | $30,250 | $65,871 |
| Interquartile 75% (IQ3) | $48,922 | $94,075 |
| Interquartile Range (IQR) | $18,672 | $28,203 |
| Standard Deviation (Sample) | $11,138 | $22,775 |
| Standard Deviation (Population) | $10,882 | $22,333 |
Similar Demographics by Householder Income Over 65 years
Demographics Similar to Ute by Householder Income Over 65 years
In terms of householder income over 65 years, the demographic groups most similar to Ute are Pueblo ($52,930, a difference of 0.040%), Pennsylvania German ($52,888, a difference of 0.11%), Choctaw ($53,060, a difference of 0.21%), Hispanic or Latino ($52,832, a difference of 0.22%), and Spanish American Indian ($53,077, a difference of 0.24%).
| Demographics | Rating | Rank | Householder Income Over 65 years |
| Immigrants | Latin America | 0.0 /100 | #297 | Tragic $53,265 |
| Central American Indians | 0.0 /100 | #298 | Tragic $53,232 |
| Ottawa | 0.0 /100 | #299 | Tragic $53,217 |
| Immigrants | Bahamas | 0.0 /100 | #300 | Tragic $53,174 |
| Yuman | 0.0 /100 | #301 | Tragic $53,110 |
| Spanish American Indians | 0.0 /100 | #302 | Tragic $53,077 |
| Choctaw | 0.0 /100 | #303 | Tragic $53,060 |
| Ute | 0.0 /100 | #304 | Tragic $52,949 |
| Pueblo | 0.0 /100 | #305 | Tragic $52,930 |
| Pennsylvania Germans | 0.0 /100 | #306 | Tragic $52,888 |
| Hispanics or Latinos | 0.0 /100 | #307 | Tragic $52,832 |
| Immigrants | Mexico | 0.0 /100 | #308 | Tragic $52,801 |
| Hondurans | 0.0 /100 | #309 | Tragic $52,634 |
| Sioux | 0.0 /100 | #310 | Tragic $52,509 |
| Seminole | 0.0 /100 | #311 | Tragic $52,373 |
Demographics Similar to Immigrants from Sweden by Householder Income Over 65 years
In terms of householder income over 65 years, the demographic groups most similar to Immigrants from Sweden are Immigrants from Belgium ($69,703, a difference of 0.030%), Immigrants from Japan ($69,774, a difference of 0.070%), Immigrants from Israel ($69,857, a difference of 0.19%), Immigrants from Eastern Asia ($69,872, a difference of 0.22%), and Immigrants from Sri Lanka ($69,426, a difference of 0.43%).
| Demographics | Rating | Rank | Householder Income Over 65 years |
| Immigrants | Korea | 100.0 /100 | #17 | Exceptional $70,696 |
| Eastern Europeans | 100.0 /100 | #18 | Exceptional $70,470 |
| Indians (Asian) | 100.0 /100 | #19 | Exceptional $70,238 |
| Immigrants | South Central Asia | 100.0 /100 | #20 | Exceptional $70,103 |
| Immigrants | Eastern Asia | 100.0 /100 | #21 | Exceptional $69,872 |
| Immigrants | Israel | 100.0 /100 | #22 | Exceptional $69,857 |
| Immigrants | Japan | 100.0 /100 | #23 | Exceptional $69,774 |
| Immigrants | Sweden | 100.0 /100 | #24 | Exceptional $69,722 |
| Immigrants | Belgium | 100.0 /100 | #25 | Exceptional $69,703 |
| Immigrants | Sri Lanka | 100.0 /100 | #26 | Exceptional $69,426 |
| Immigrants | Switzerland | 100.0 /100 | #27 | Exceptional $69,343 |
| Immigrants | China | 100.0 /100 | #28 | Exceptional $69,174 |
| Immigrants | Australia | 100.0 /100 | #29 | Exceptional $69,164 |
| Immigrants | Northern Europe | 100.0 /100 | #30 | Exceptional $69,003 |
| Afghans | 100.0 /100 | #31 | Exceptional $68,951 |