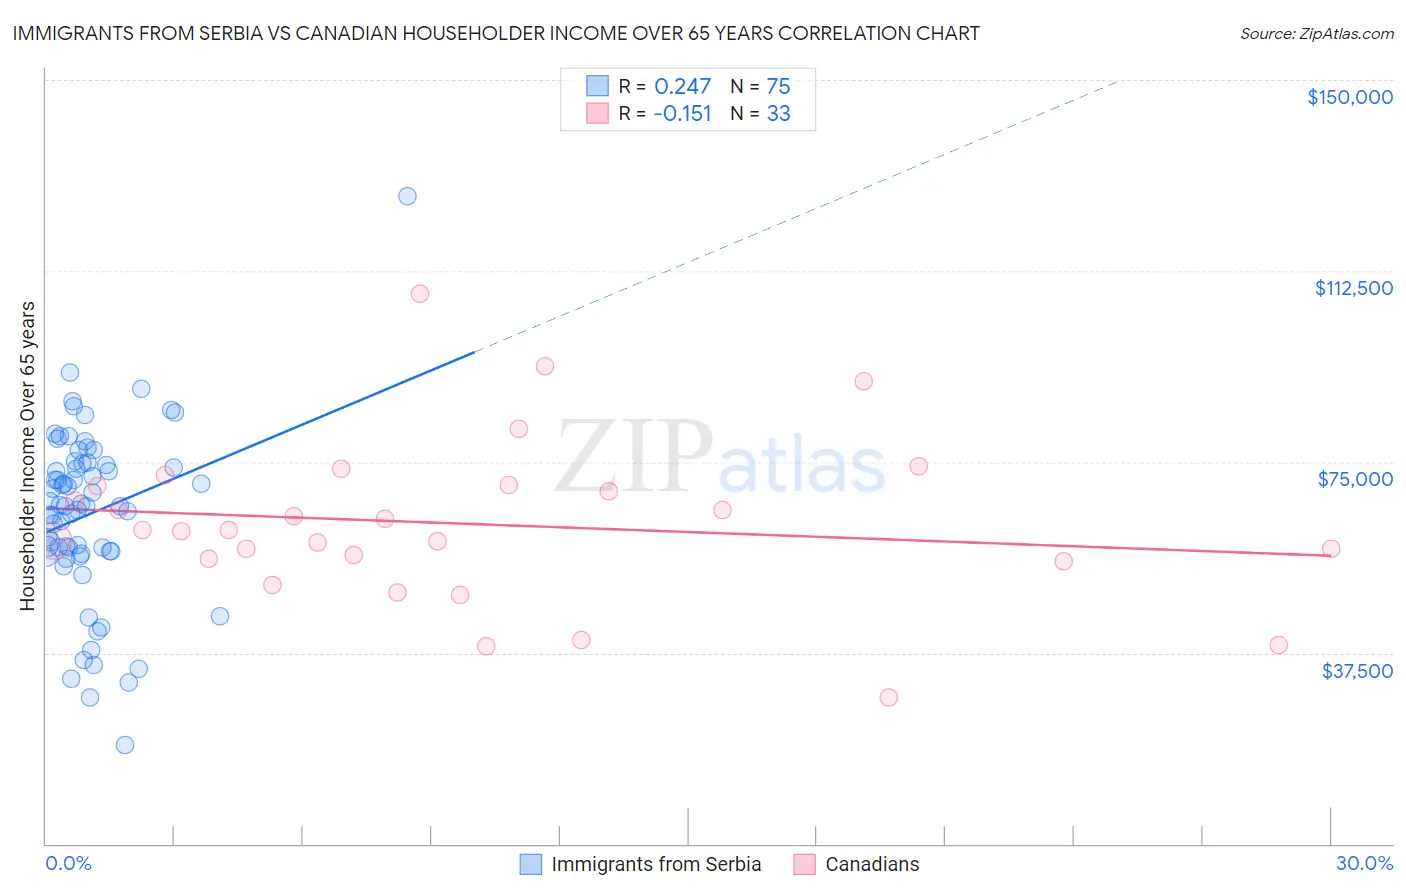
Immigrants from Serbia vs Canadian Householder Income Over 65 years
COMPARE
Immigrants from Serbia
Canadian
Householder Income Over 65 years
Householder Income Over 65 years Comparison
Immigrants from Serbia
Canadians
$63,387
HOUSEHOLDER INCOME OVER 65 YEARS
92.7/ 100
METRIC RATING
113th/ 347
METRIC RANK
$62,230
HOUSEHOLDER INCOME OVER 65 YEARS
79.0/ 100
METRIC RATING
141st/ 347
METRIC RANK
Immigrants from Serbia vs Canadian Householder Income Over 65 years Correlation Chart
The statistical analysis conducted on geographies consisting of 131,644,456 people shows a weak positive correlation between the proportion of Immigrants from Serbia and household income with householder over the age of 65 in the United States with a correlation coefficient (R) of 0.247 and weighted average of $63,387. Similarly, the statistical analysis conducted on geographies consisting of 436,051,930 people shows a poor negative correlation between the proportion of Canadians and household income with householder over the age of 65 in the United States with a correlation coefficient (R) of -0.151 and weighted average of $62,230, a difference of 1.9%.
Householder Income Over 65 years Correlation Summary
| Measurement | Immigrants from Serbia | Canadian |
| Minimum | $19,307 | $28,616 |
| Maximum | $127,250 | $108,103 |
| Range | $107,943 | $79,487 |
| Mean | $64,869 | $62,811 |
| Median | $66,375 | $61,617 |
| Interquartile 25% (IQ1) | $57,419 | $55,674 |
| Interquartile 75% (IQ3) | $74,688 | $70,369 |
| Interquartile Range (IQR) | $17,269 | $14,695 |
| Standard Deviation (Sample) | $17,146 | $16,050 |
| Standard Deviation (Population) | $17,032 | $15,805 |
Similar Demographics by Householder Income Over 65 years
Demographics Similar to Immigrants from Serbia by Householder Income Over 65 years
In terms of householder income over 65 years, the demographic groups most similar to Immigrants from Serbia are Immigrants from Saudi Arabia ($63,355, a difference of 0.050%), Syrian ($63,494, a difference of 0.17%), Immigrants from Spain ($63,540, a difference of 0.24%), Croatian ($63,225, a difference of 0.26%), and Guamanian/Chamorro ($63,187, a difference of 0.32%).
| Demographics | Rating | Rank | Householder Income Over 65 years |
| Immigrants | Argentina | 95.5 /100 | #106 | Exceptional $63,885 |
| Pakistanis | 95.3 /100 | #107 | Exceptional $63,844 |
| Palestinians | 95.1 /100 | #108 | Exceptional $63,800 |
| Europeans | 95.0 /100 | #109 | Exceptional $63,779 |
| Immigrants | Zimbabwe | 94.3 /100 | #110 | Exceptional $63,643 |
| Immigrants | Spain | 93.7 /100 | #111 | Exceptional $63,540 |
| Syrians | 93.4 /100 | #112 | Exceptional $63,494 |
| Immigrants | Serbia | 92.7 /100 | #113 | Exceptional $63,387 |
| Immigrants | Saudi Arabia | 92.4 /100 | #114 | Exceptional $63,355 |
| Croatians | 91.4 /100 | #115 | Exceptional $63,225 |
| Guamanians/Chamorros | 91.1 /100 | #116 | Exceptional $63,187 |
| Immigrants | Croatia | 90.9 /100 | #117 | Exceptional $63,168 |
| Danes | 90.5 /100 | #118 | Exceptional $63,117 |
| Immigrants | Jordan | 89.8 /100 | #119 | Excellent $63,041 |
| Ukrainians | 89.7 /100 | #120 | Excellent $63,032 |
Demographics Similar to Canadians by Householder Income Over 65 years
In terms of householder income over 65 years, the demographic groups most similar to Canadians are South American Indian ($62,215, a difference of 0.020%), Arab ($62,266, a difference of 0.060%), Lebanese ($62,287, a difference of 0.090%), Immigrants from Kazakhstan ($62,292, a difference of 0.10%), and Immigrants from Belarus ($62,162, a difference of 0.11%).
| Demographics | Rating | Rank | Householder Income Over 65 years |
| Immigrants | Brazil | 81.2 /100 | #134 | Excellent $62,364 |
| Immigrants | Chile | 81.0 /100 | #135 | Excellent $62,354 |
| Alaskan Athabascans | 80.6 /100 | #136 | Excellent $62,330 |
| Immigrants | Syria | 80.2 /100 | #137 | Excellent $62,303 |
| Immigrants | Kazakhstan | 80.0 /100 | #138 | Excellent $62,292 |
| Lebanese | 79.9 /100 | #139 | Good $62,287 |
| Arabs | 79.6 /100 | #140 | Good $62,266 |
| Canadians | 79.0 /100 | #141 | Good $62,230 |
| South American Indians | 78.7 /100 | #142 | Good $62,215 |
| Immigrants | Belarus | 77.8 /100 | #143 | Good $62,162 |
| Immigrants | Peru | 74.4 /100 | #144 | Good $61,988 |
| Immigrants | Uganda | 74.2 /100 | #145 | Good $61,976 |
| Immigrants | Southern Europe | 72.7 /100 | #146 | Good $61,902 |
| Immigrants | Nepal | 71.4 /100 | #147 | Good $61,843 |
| Alsatians | 70.5 /100 | #148 | Good $61,797 |