Immigrants from Vietnam vs Canadian Householder Income Over 65 years
COMPARE
Immigrants from Vietnam
Canadian
Householder Income Over 65 years
Householder Income Over 65 years Comparison
Immigrants from Vietnam
Canadians
$63,014
HOUSEHOLDER INCOME OVER 65 YEARS
89.5/ 100
METRIC RATING
121st/ 347
METRIC RANK
$62,230
HOUSEHOLDER INCOME OVER 65 YEARS
79.0/ 100
METRIC RATING
141st/ 347
METRIC RANK
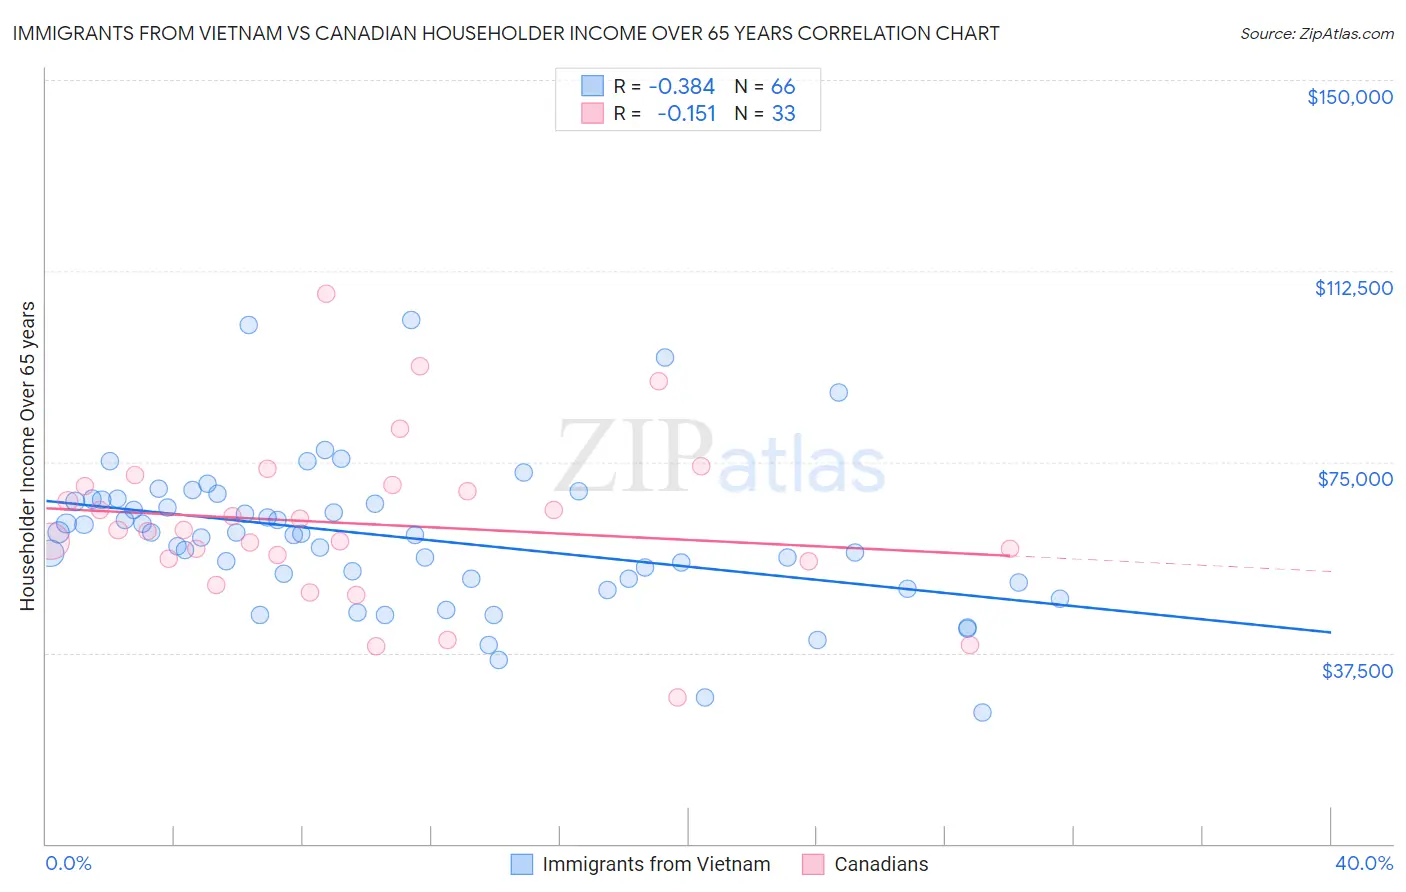
Immigrants from Vietnam vs Canadian Householder Income Over 65 years Correlation Chart
The statistical analysis conducted on geographies consisting of 403,537,097 people shows a mild negative correlation between the proportion of Immigrants from Vietnam and household income with householder over the age of 65 in the United States with a correlation coefficient (R) of -0.384 and weighted average of $63,014. Similarly, the statistical analysis conducted on geographies consisting of 436,051,930 people shows a poor negative correlation between the proportion of Canadians and household income with householder over the age of 65 in the United States with a correlation coefficient (R) of -0.151 and weighted average of $62,230, a difference of 1.3%.
Householder Income Over 65 years Correlation Summary
| Measurement | Immigrants from Vietnam | Canadian |
| Minimum | $25,692 | $28,616 |
| Maximum | $102,879 | $108,103 |
| Range | $77,187 | $79,487 |
| Mean | $60,196 | $62,811 |
| Median | $60,741 | $61,617 |
| Interquartile 25% (IQ1) | $51,982 | $55,674 |
| Interquartile 75% (IQ3) | $67,632 | $70,369 |
| Interquartile Range (IQR) | $15,650 | $14,695 |
| Standard Deviation (Sample) | $14,568 | $16,050 |
| Standard Deviation (Population) | $14,457 | $15,805 |
Demographics Similar to Immigrants from Vietnam and Canadians by Householder Income Over 65 years
In terms of householder income over 65 years, the demographic groups most similar to Immigrants from Vietnam are Immigrants from Moldova ($62,939, a difference of 0.12%), Tlingit-Haida ($62,922, a difference of 0.15%), Taiwanese ($62,894, a difference of 0.19%), Soviet Union ($62,848, a difference of 0.26%), and Peruvian ($62,766, a difference of 0.40%). Similarly, the demographic groups most similar to Canadians are Arab ($62,266, a difference of 0.060%), Lebanese ($62,287, a difference of 0.090%), Immigrants from Kazakhstan ($62,292, a difference of 0.10%), Immigrants from Syria ($62,303, a difference of 0.12%), and Alaskan Athabascan ($62,330, a difference of 0.16%).
| Demographics | Rating | Rank | Householder Income Over 65 years |
| Immigrants | Vietnam | 89.5 /100 | #121 | Excellent $63,014 |
| Immigrants | Moldova | 88.7 /100 | #122 | Excellent $62,939 |
| Tlingit-Haida | 88.6 /100 | #123 | Excellent $62,922 |
| Taiwanese | 88.3 /100 | #124 | Excellent $62,894 |
| Soviet Union | 87.8 /100 | #125 | Excellent $62,848 |
| Peruvians | 86.8 /100 | #126 | Excellent $62,766 |
| Swedes | 86.4 /100 | #127 | Excellent $62,736 |
| Aleuts | 86.1 /100 | #128 | Excellent $62,708 |
| Immigrants | Eastern Europe | 85.9 /100 | #129 | Excellent $62,693 |
| Basques | 85.4 /100 | #130 | Excellent $62,653 |
| Immigrants | Western Asia | 85.3 /100 | #131 | Excellent $62,645 |
| Immigrants | Germany | 83.9 /100 | #132 | Excellent $62,544 |
| Immigrants | Northern Africa | 83.6 /100 | #133 | Excellent $62,522 |
| Immigrants | Brazil | 81.2 /100 | #134 | Excellent $62,364 |
| Immigrants | Chile | 81.0 /100 | #135 | Excellent $62,354 |
| Alaskan Athabascans | 80.6 /100 | #136 | Excellent $62,330 |
| Immigrants | Syria | 80.2 /100 | #137 | Excellent $62,303 |
| Immigrants | Kazakhstan | 80.0 /100 | #138 | Excellent $62,292 |
| Lebanese | 79.9 /100 | #139 | Good $62,287 |
| Arabs | 79.6 /100 | #140 | Good $62,266 |
| Canadians | 79.0 /100 | #141 | Good $62,230 |