Portuguese vs Canadian Householder Income Over 65 years
COMPARE
Portuguese
Canadian
Householder Income Over 65 years
Householder Income Over 65 years Comparison
Portuguese
Canadians
$61,440
HOUSEHOLDER INCOME OVER 65 YEARS
62.1/ 100
METRIC RATING
160th/ 347
METRIC RANK
$62,230
HOUSEHOLDER INCOME OVER 65 YEARS
79.0/ 100
METRIC RATING
141st/ 347
METRIC RANK
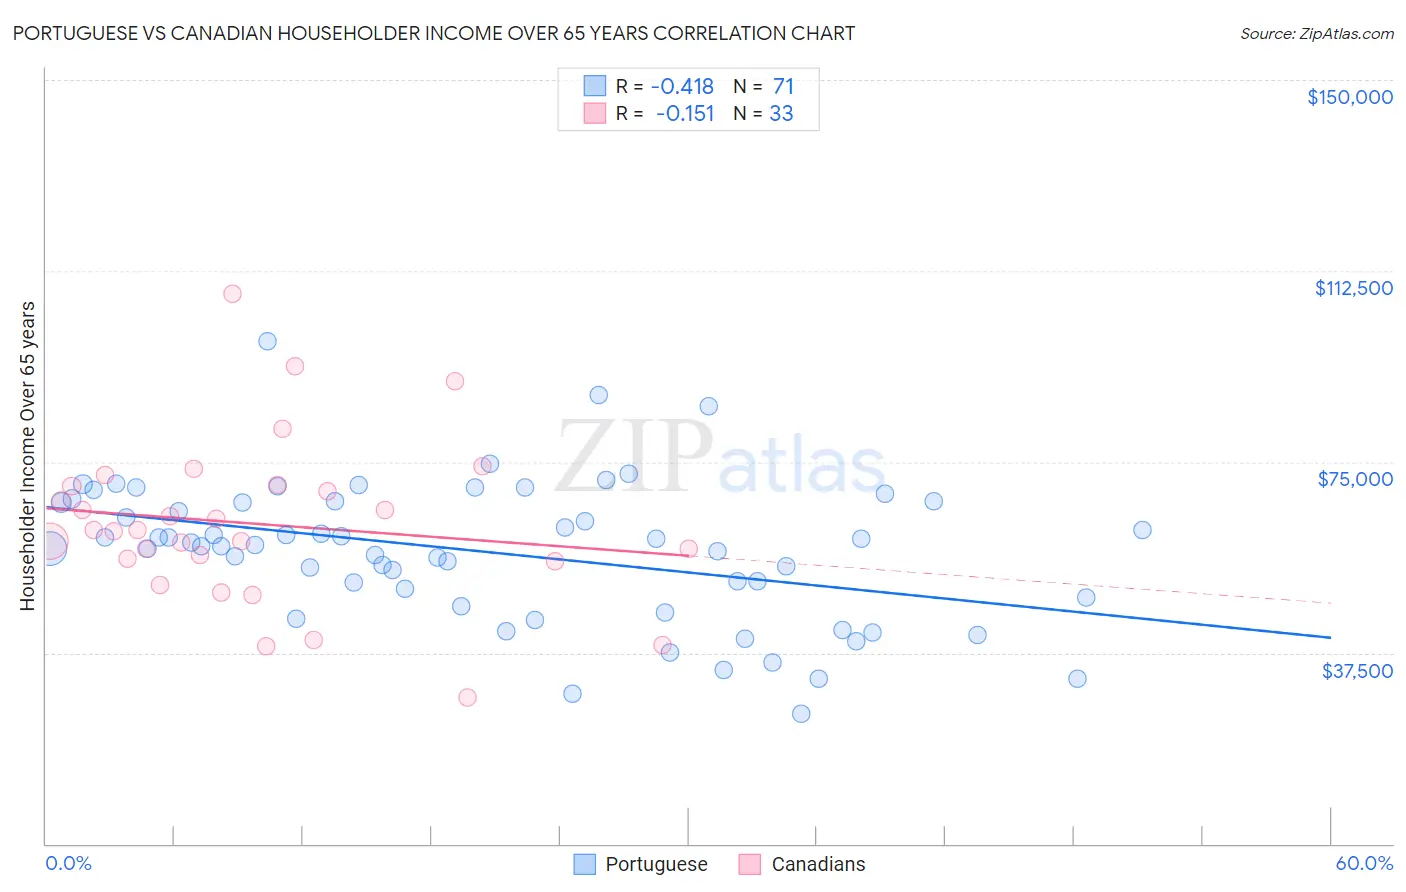
Portuguese vs Canadian Householder Income Over 65 years Correlation Chart
The statistical analysis conducted on geographies consisting of 448,159,780 people shows a moderate negative correlation between the proportion of Portuguese and household income with householder over the age of 65 in the United States with a correlation coefficient (R) of -0.418 and weighted average of $61,440. Similarly, the statistical analysis conducted on geographies consisting of 436,051,930 people shows a poor negative correlation between the proportion of Canadians and household income with householder over the age of 65 in the United States with a correlation coefficient (R) of -0.151 and weighted average of $62,230, a difference of 1.3%.
Householder Income Over 65 years Correlation Summary
| Measurement | Portuguese | Canadian |
| Minimum | $25,525 | $28,616 |
| Maximum | $98,662 | $108,103 |
| Range | $73,137 | $79,487 |
| Mean | $57,386 | $62,811 |
| Median | $58,571 | $61,617 |
| Interquartile 25% (IQ1) | $48,306 | $55,674 |
| Interquartile 75% (IQ3) | $67,302 | $70,369 |
| Interquartile Range (IQR) | $18,996 | $14,695 |
| Standard Deviation (Sample) | $13,814 | $16,050 |
| Standard Deviation (Population) | $13,716 | $15,805 |
Demographics Similar to Portuguese and Canadians by Householder Income Over 65 years
In terms of householder income over 65 years, the demographic groups most similar to Portuguese are Brazilian ($61,465, a difference of 0.040%), English ($61,487, a difference of 0.080%), Macedonian ($61,564, a difference of 0.20%), Scandinavian ($61,586, a difference of 0.24%), and Polish ($61,598, a difference of 0.26%). Similarly, the demographic groups most similar to Canadians are South American Indian ($62,215, a difference of 0.020%), Arab ($62,266, a difference of 0.060%), Immigrants from Belarus ($62,162, a difference of 0.11%), Immigrants from Peru ($61,988, a difference of 0.39%), and Immigrants from Uganda ($61,976, a difference of 0.41%).
| Demographics | Rating | Rank | Householder Income Over 65 years |
| Arabs | 79.6 /100 | #140 | Good $62,266 |
| Canadians | 79.0 /100 | #141 | Good $62,230 |
| South American Indians | 78.7 /100 | #142 | Good $62,215 |
| Immigrants | Belarus | 77.8 /100 | #143 | Good $62,162 |
| Immigrants | Peru | 74.4 /100 | #144 | Good $61,988 |
| Immigrants | Uganda | 74.2 /100 | #145 | Good $61,976 |
| Immigrants | Southern Europe | 72.7 /100 | #146 | Good $61,902 |
| Immigrants | Nepal | 71.4 /100 | #147 | Good $61,843 |
| Alsatians | 70.5 /100 | #148 | Good $61,797 |
| Scottish | 69.1 /100 | #149 | Good $61,735 |
| Slavs | 68.5 /100 | #150 | Good $61,709 |
| Hungarians | 67.7 /100 | #151 | Good $61,673 |
| Armenians | 67.3 /100 | #152 | Good $61,656 |
| Costa Ricans | 66.9 /100 | #153 | Good $61,638 |
| Swiss | 66.5 /100 | #154 | Good $61,621 |
| Poles | 65.9 /100 | #155 | Good $61,598 |
| Scandinavians | 65.6 /100 | #156 | Good $61,586 |
| Macedonians | 65.1 /100 | #157 | Good $61,564 |
| English | 63.3 /100 | #158 | Good $61,487 |
| Brazilians | 62.7 /100 | #159 | Good $61,465 |
| Portuguese | 62.1 /100 | #160 | Good $61,440 |