Immigrants from Kazakhstan vs Argentinean Per Capita Income
COMPARE
Immigrants from Kazakhstan
Argentinean
Per Capita Income
Per Capita Income Comparison
Immigrants from Kazakhstan
Argentineans
$48,747
PER CAPITA INCOME
99.7/ 100
METRIC RATING
77th/ 347
METRIC RANK
$49,862
PER CAPITA INCOME
99.9/ 100
METRIC RATING
61st/ 347
METRIC RANK
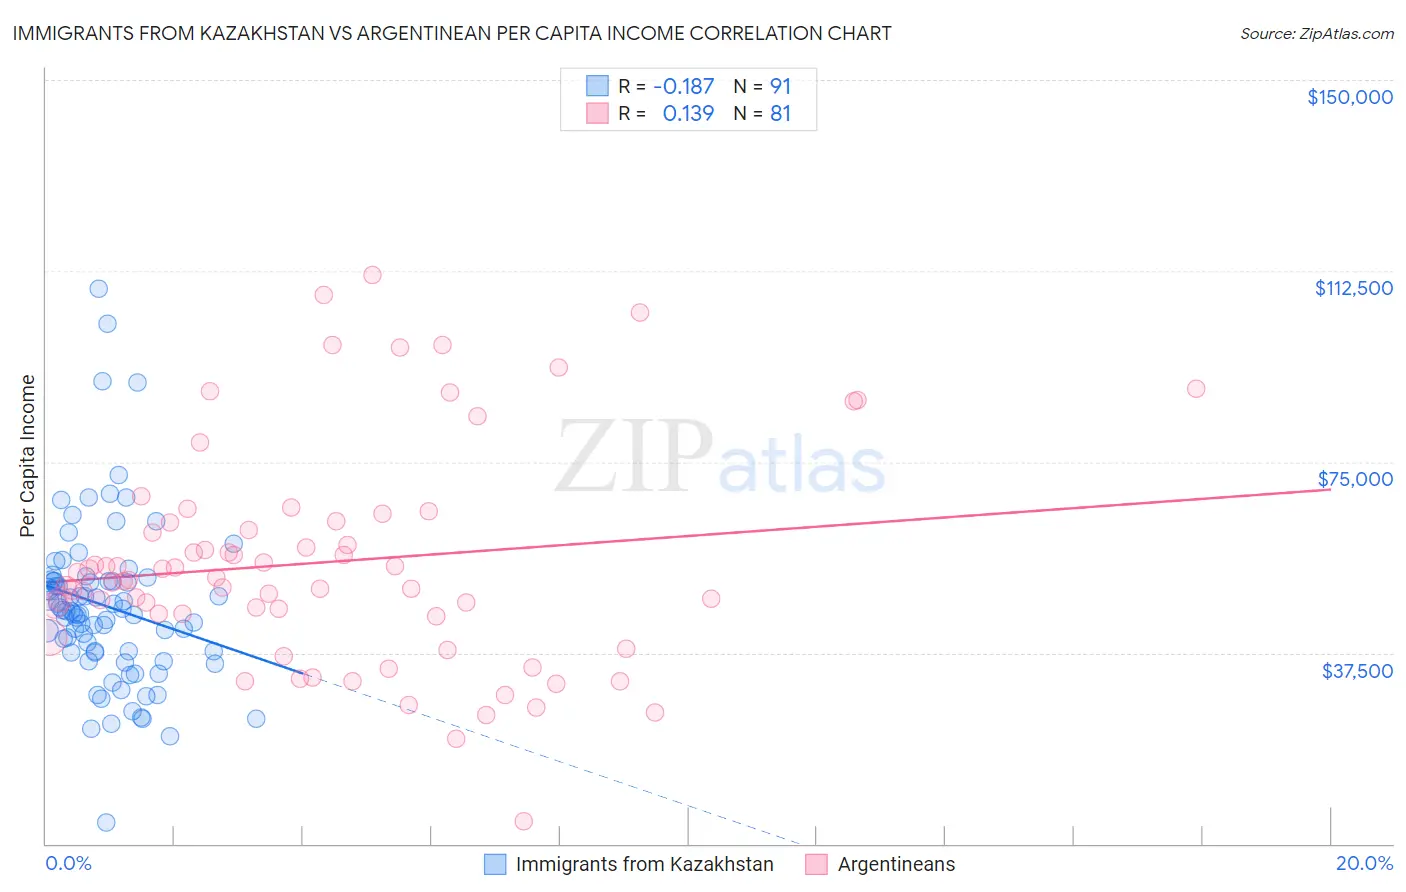
Immigrants from Kazakhstan vs Argentinean Per Capita Income Correlation Chart
The statistical analysis conducted on geographies consisting of 124,442,915 people shows a poor negative correlation between the proportion of Immigrants from Kazakhstan and per capita income in the United States with a correlation coefficient (R) of -0.187 and weighted average of $48,747. Similarly, the statistical analysis conducted on geographies consisting of 297,154,403 people shows a poor positive correlation between the proportion of Argentineans and per capita income in the United States with a correlation coefficient (R) of 0.139 and weighted average of $49,862, a difference of 2.3%.
Per Capita Income Correlation Summary
| Measurement | Immigrants from Kazakhstan | Argentinean |
| Minimum | $4,252 | $4,418 |
| Maximum | $109,103 | $111,640 |
| Range | $104,851 | $107,222 |
| Mean | $46,679 | $55,287 |
| Median | $45,620 | $51,750 |
| Interquartile 25% (IQ1) | $37,540 | $44,864 |
| Interquartile 75% (IQ3) | $51,665 | $63,214 |
| Interquartile Range (IQR) | $14,125 | $18,350 |
| Standard Deviation (Sample) | $16,400 | $21,524 |
| Standard Deviation (Population) | $16,310 | $21,390 |
Demographics Similar to Immigrants from Kazakhstan and Argentineans by Per Capita Income
In terms of per capita income, the demographic groups most similar to Immigrants from Kazakhstan are Immigrants from Italy ($48,654, a difference of 0.19%), Immigrants from England ($48,844, a difference of 0.20%), Immigrants from Bolivia ($48,970, a difference of 0.46%), Romanian ($48,445, a difference of 0.62%), and Mongolian ($49,173, a difference of 0.87%). Similarly, the demographic groups most similar to Argentineans are Immigrants from Scotland ($49,893, a difference of 0.060%), Bhutanese ($49,894, a difference of 0.070%), Immigrants from Asia ($49,741, a difference of 0.24%), Maltese ($49,640, a difference of 0.45%), and Immigrants from Argentina ($49,627, a difference of 0.47%).
| Demographics | Rating | Rank | Per Capita Income |
| Bhutanese | 99.9 /100 | #59 | Exceptional $49,894 |
| Immigrants | Scotland | 99.9 /100 | #60 | Exceptional $49,893 |
| Argentineans | 99.9 /100 | #61 | Exceptional $49,862 |
| Immigrants | Asia | 99.9 /100 | #62 | Exceptional $49,741 |
| Maltese | 99.9 /100 | #63 | Exceptional $49,640 |
| Immigrants | Argentina | 99.9 /100 | #64 | Exceptional $49,627 |
| Bolivians | 99.9 /100 | #65 | Exceptional $49,526 |
| Immigrants | Bulgaria | 99.9 /100 | #66 | Exceptional $49,482 |
| Immigrants | Romania | 99.9 /100 | #67 | Exceptional $49,463 |
| Lithuanians | 99.8 /100 | #68 | Exceptional $49,448 |
| Immigrants | Canada | 99.8 /100 | #69 | Exceptional $49,412 |
| Immigrants | Eastern Europe | 99.8 /100 | #70 | Exceptional $49,316 |
| Greeks | 99.8 /100 | #71 | Exceptional $49,309 |
| Immigrants | Hungary | 99.8 /100 | #72 | Exceptional $49,303 |
| Immigrants | North America | 99.8 /100 | #73 | Exceptional $49,302 |
| Mongolians | 99.8 /100 | #74 | Exceptional $49,173 |
| Immigrants | Bolivia | 99.7 /100 | #75 | Exceptional $48,970 |
| Immigrants | England | 99.7 /100 | #76 | Exceptional $48,844 |
| Immigrants | Kazakhstan | 99.7 /100 | #77 | Exceptional $48,747 |
| Immigrants | Italy | 99.6 /100 | #78 | Exceptional $48,654 |
| Romanians | 99.5 /100 | #79 | Exceptional $48,445 |