Italian vs Argentinean Per Capita Income
COMPARE
Italian
Argentinean
Per Capita Income
Per Capita Income Comparison
Italians
Argentineans
$47,574
PER CAPITA INCOME
98.8/ 100
METRIC RATING
90th/ 347
METRIC RANK
$49,862
PER CAPITA INCOME
99.9/ 100
METRIC RATING
61st/ 347
METRIC RANK
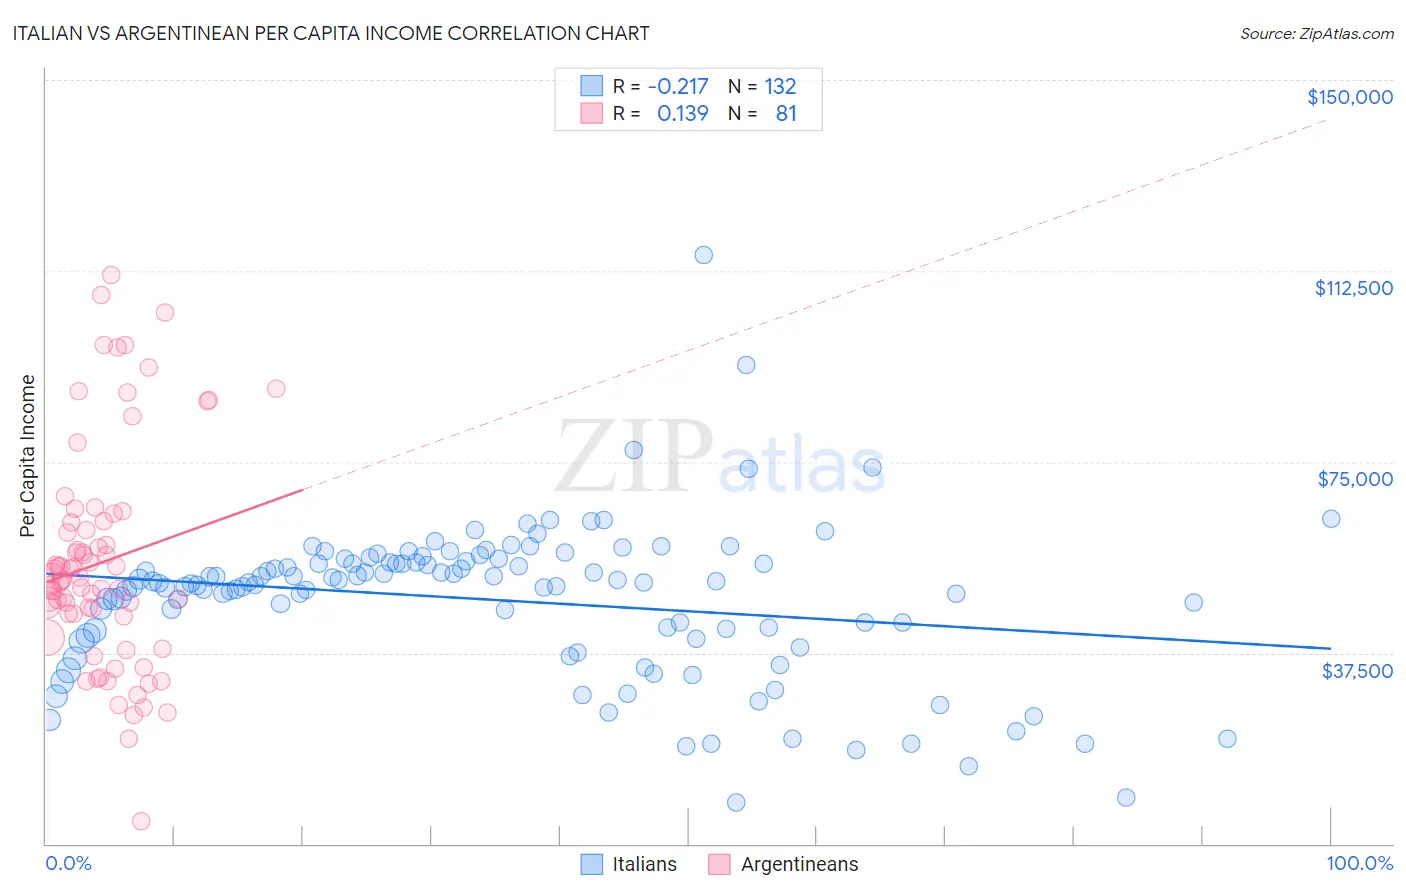
Italian vs Argentinean Per Capita Income Correlation Chart
The statistical analysis conducted on geographies consisting of 575,176,397 people shows a weak negative correlation between the proportion of Italians and per capita income in the United States with a correlation coefficient (R) of -0.217 and weighted average of $47,574. Similarly, the statistical analysis conducted on geographies consisting of 297,154,403 people shows a poor positive correlation between the proportion of Argentineans and per capita income in the United States with a correlation coefficient (R) of 0.139 and weighted average of $49,862, a difference of 4.8%.
Per Capita Income Correlation Summary
| Measurement | Italian | Argentinean |
| Minimum | $7,984 | $4,418 |
| Maximum | $115,662 | $111,640 |
| Range | $107,678 | $107,222 |
| Mean | $47,928 | $55,287 |
| Median | $51,120 | $51,750 |
| Interquartile 25% (IQ1) | $41,399 | $44,864 |
| Interquartile 75% (IQ3) | $55,329 | $63,214 |
| Interquartile Range (IQR) | $13,930 | $18,350 |
| Standard Deviation (Sample) | $15,071 | $21,524 |
| Standard Deviation (Population) | $15,014 | $21,390 |
Similar Demographics by Per Capita Income
Demographics Similar to Italians by Per Capita Income
In terms of per capita income, the demographic groups most similar to Italians are Macedonian ($47,573, a difference of 0.0%), Immigrants from Moldova ($47,489, a difference of 0.18%), Northern European ($47,698, a difference of 0.26%), Croatian ($47,742, a difference of 0.35%), and Immigrants from Zimbabwe ($47,394, a difference of 0.38%).
| Demographics | Rating | Rank | Per Capita Income |
| Immigrants | Brazil | 99.4 /100 | #83 | Exceptional $48,164 |
| Immigrants | Ukraine | 99.3 /100 | #84 | Exceptional $48,134 |
| Austrians | 99.3 /100 | #85 | Exceptional $48,116 |
| Immigrants | Southern Europe | 99.3 /100 | #86 | Exceptional $48,027 |
| Ukrainians | 99.3 /100 | #87 | Exceptional $48,014 |
| Croatians | 99.0 /100 | #88 | Exceptional $47,742 |
| Northern Europeans | 98.9 /100 | #89 | Exceptional $47,698 |
| Italians | 98.8 /100 | #90 | Exceptional $47,574 |
| Macedonians | 98.8 /100 | #91 | Exceptional $47,573 |
| Immigrants | Moldova | 98.7 /100 | #92 | Exceptional $47,489 |
| Immigrants | Zimbabwe | 98.5 /100 | #93 | Exceptional $47,394 |
| Albanians | 98.5 /100 | #94 | Exceptional $47,379 |
| Immigrants | Egypt | 98.5 /100 | #95 | Exceptional $47,361 |
| Alsatians | 98.3 /100 | #96 | Exceptional $47,284 |
| Carpatho Rusyns | 98.2 /100 | #97 | Exceptional $47,248 |
Demographics Similar to Argentineans by Per Capita Income
In terms of per capita income, the demographic groups most similar to Argentineans are Immigrants from Scotland ($49,893, a difference of 0.060%), Bhutanese ($49,894, a difference of 0.070%), Immigrants from Malaysia ($49,983, a difference of 0.24%), Immigrants from Asia ($49,741, a difference of 0.24%), and South African ($50,044, a difference of 0.37%).
| Demographics | Rating | Rank | Per Capita Income |
| Immigrants | Belarus | 99.9 /100 | #54 | Exceptional $50,303 |
| Immigrants | Western Europe | 99.9 /100 | #55 | Exceptional $50,065 |
| Asians | 99.9 /100 | #56 | Exceptional $50,057 |
| South Africans | 99.9 /100 | #57 | Exceptional $50,044 |
| Immigrants | Malaysia | 99.9 /100 | #58 | Exceptional $49,983 |
| Bhutanese | 99.9 /100 | #59 | Exceptional $49,894 |
| Immigrants | Scotland | 99.9 /100 | #60 | Exceptional $49,893 |
| Argentineans | 99.9 /100 | #61 | Exceptional $49,862 |
| Immigrants | Asia | 99.9 /100 | #62 | Exceptional $49,741 |
| Maltese | 99.9 /100 | #63 | Exceptional $49,640 |
| Immigrants | Argentina | 99.9 /100 | #64 | Exceptional $49,627 |
| Bolivians | 99.9 /100 | #65 | Exceptional $49,526 |
| Immigrants | Bulgaria | 99.9 /100 | #66 | Exceptional $49,482 |
| Immigrants | Romania | 99.9 /100 | #67 | Exceptional $49,463 |
| Lithuanians | 99.8 /100 | #68 | Exceptional $49,448 |