Ugandan vs Jordanian 8th Grade
COMPARE
Ugandan
Jordanian
8th Grade
8th Grade Comparison
Ugandans
Jordanians
95.9%
8TH GRADE
74.1/ 100
METRIC RATING
156th/ 347
METRIC RANK
96.1%
8TH GRADE
91.3/ 100
METRIC RATING
136th/ 347
METRIC RANK
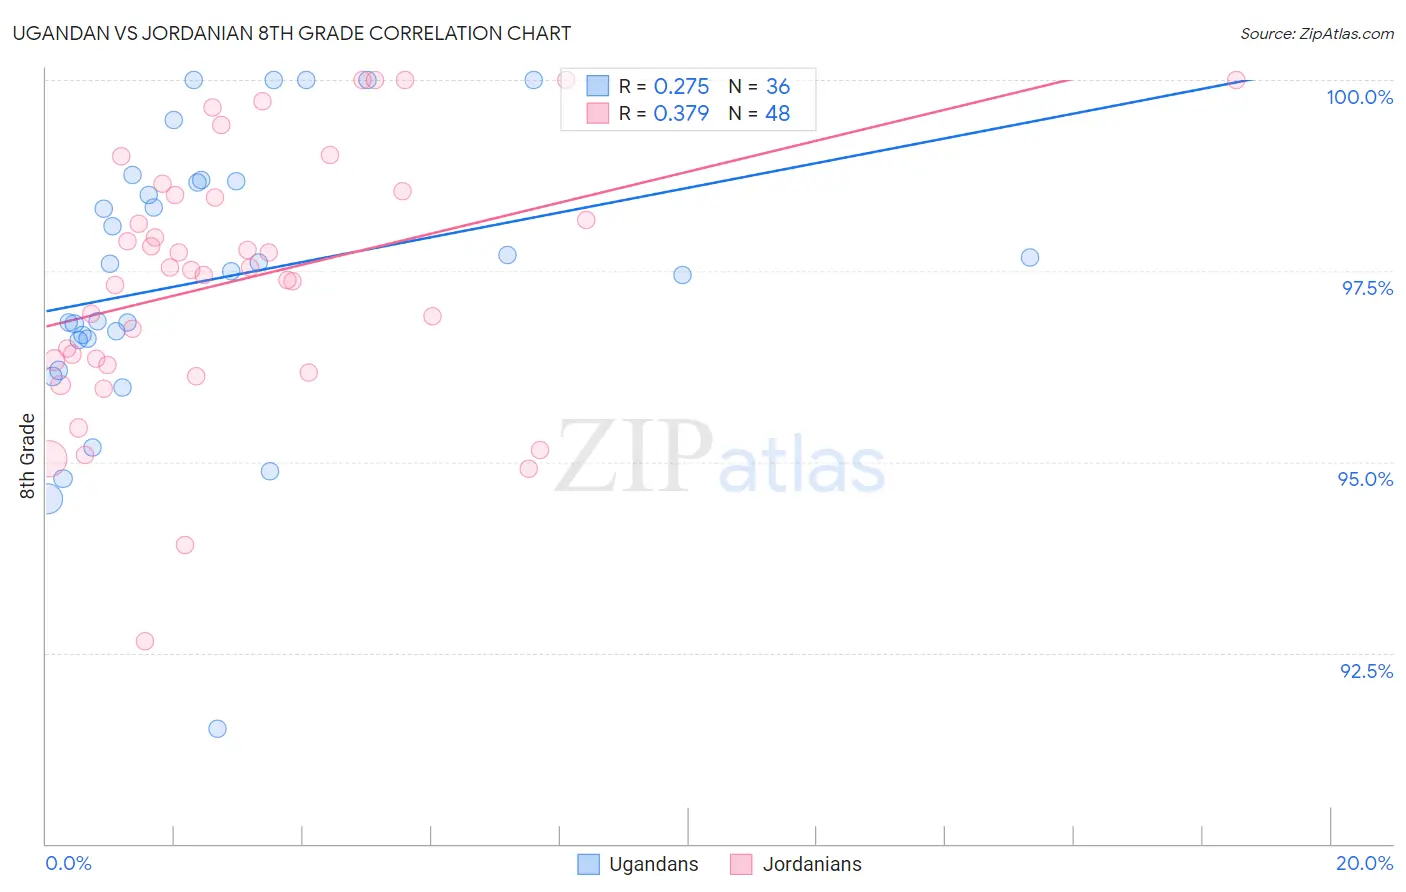
Ugandan vs Jordanian 8th Grade Correlation Chart
The statistical analysis conducted on geographies consisting of 93,991,892 people shows a weak positive correlation between the proportion of Ugandans and percentage of population with at least 8th grade education in the United States with a correlation coefficient (R) of 0.275 and weighted average of 95.9%. Similarly, the statistical analysis conducted on geographies consisting of 166,403,553 people shows a mild positive correlation between the proportion of Jordanians and percentage of population with at least 8th grade education in the United States with a correlation coefficient (R) of 0.379 and weighted average of 96.1%, a difference of 0.21%.
8th Grade Correlation Summary
| Measurement | Ugandan | Jordanian |
| Minimum | 91.5% | 92.6% |
| Maximum | 100.0% | 100.0% |
| Range | 8.5% | 7.4% |
| Mean | 97.4% | 97.4% |
| Median | 97.5% | 97.5% |
| Interquartile 25% (IQ1) | 96.6% | 96.3% |
| Interquartile 75% (IQ3) | 98.7% | 98.5% |
| Interquartile Range (IQR) | 2.1% | 2.2% |
| Standard Deviation (Sample) | 1.8% | 1.7% |
| Standard Deviation (Population) | 1.8% | 1.7% |
Demographics Similar to Ugandans and Jordanians by 8th Grade
In terms of 8th grade, the demographic groups most similar to Ugandans are Kenyan (95.9%, a difference of 0.0%), Immigrants from Jordan (95.9%, a difference of 0.050%), Hopi (95.9%, a difference of 0.050%), Immigrants from Russia (96.0%, a difference of 0.060%), and Blackfeet (96.0%, a difference of 0.060%). Similarly, the demographic groups most similar to Jordanians are Cambodian (96.1%, a difference of 0.010%), Burmese (96.1%, a difference of 0.020%), Hmong (96.1%, a difference of 0.030%), Immigrants from South Central Asia (96.1%, a difference of 0.040%), and Immigrants from Greece (96.0%, a difference of 0.090%).
| Demographics | Rating | Rank | 8th Grade |
| Jordanians | 91.3 /100 | #136 | Exceptional 96.1% |
| Cambodians | 90.6 /100 | #137 | Exceptional 96.1% |
| Burmese | 90.2 /100 | #138 | Exceptional 96.1% |
| Hmong | 89.7 /100 | #139 | Excellent 96.1% |
| Immigrants | South Central Asia | 89.4 /100 | #140 | Excellent 96.1% |
| Immigrants | Greece | 85.9 /100 | #141 | Excellent 96.0% |
| Immigrants | Eastern Europe | 85.4 /100 | #142 | Excellent 96.0% |
| Spanish | 85.1 /100 | #143 | Excellent 96.0% |
| Immigrants | Belarus | 84.8 /100 | #144 | Excellent 96.0% |
| Lumbee | 84.1 /100 | #145 | Excellent 96.0% |
| Israelis | 84.1 /100 | #146 | Excellent 96.0% |
| Colville | 84.0 /100 | #147 | Excellent 96.0% |
| Albanians | 83.1 /100 | #148 | Excellent 96.0% |
| Immigrants | Israel | 81.3 /100 | #149 | Excellent 96.0% |
| Immigrants | Russia | 80.9 /100 | #150 | Excellent 96.0% |
| Blackfeet | 80.8 /100 | #151 | Excellent 96.0% |
| French American Indians | 80.6 /100 | #152 | Excellent 96.0% |
| Immigrants | Jordan | 79.5 /100 | #153 | Good 95.9% |
| Hopi | 79.4 /100 | #154 | Good 95.9% |
| Kenyans | 74.5 /100 | #155 | Good 95.9% |
| Ugandans | 74.1 /100 | #156 | Good 95.9% |